


 Top Rated Course

We may not have the course you’re looking for. If you enquire or give us a call on +44 1344 203999 and speak to our training experts, we may still be able to help with your training requirements.
MATLAB Colormaps: A Comprehensive Guide
Sienna Roberts 08 April 2025Explore the field of MATLAB Colormaps to learn about the versatility and power of MATLAB Colormaps, from built-in options to create your own. Learn how to enhance Data Visualisation with MATLAB Colormap and make your plots come to life with the perfect colour scheme. Read this blog to learn more about MATLAB Colormaps.
Training Outcomes Within Your Budget!
We ensure quality, budget-alignment, and timely delivery by our expert instructors.

MATLAB Colormaps are one of the most helpful resources for understanding data more comprehensibly. They map numerical values to colors, which explains Big Data and helps make the patterns stand out. MATLAB has numerous options, and there is also an opportunity to develop individual Colormaps.
From emphasising temperature changes to denoting topographical differences to summarising statistical outcomes, the choice of colours can dramatically affect the efficacy and clarity of the graphics. Understanding MATLAB Colormaps will help you represent your data better and more aesthetically pleasingly.
So, what are you waiting for? Read this blog further to learn more about MATLAB Colormaps.
Table of Contents
1) Understanding Colormaps in MATLAB
2) Types of MATLAB Colormaps
3) Choosing your Colormap
4) Creating your Custom Colormaps
5) Tips to Create Custom Colormaps
6) Conclusion
Understanding Colormaps in MATLAB
Colormaps are an essential component of Data Visualisation that help convey information effectively. They Are a mapping between numerical values and colours. A Colormap assigns a unique colour to each value or range of values in a dataset, allowing for a visual representation of the data's characteristics.
The primary purpose of Colormaps is to enhance the understanding and interpretation of data. They bring out patterns, trends, and variations in the data by associating different colours with different values or categories. Colormaps help express both continuous and categorical data. They are three-column MATLAB Arrays with RGB triplets.
Colormaps create a smooth transition of colours that indicate the changing values for continuous data, such as temperature or elevation. This enables viewers to perceive gradients and identify high or low points quickly. On the other hand, categorical Colormaps with MATLAB Operators assign distinct colours to different categories, facilitating the differentiation of discrete groups or classes.
Furthermore, Data Visualisations become more intuitive by employing the appropriate Colormaps, allowing viewers to grasp information quickly and make informed decisions.
Set Colormap
Setting Colormaps in MATLAB is a straightforward yet powerful way to enhance Data Visualisation. A Colormap is an m-by-3 matrix of real numbers between 0.0 and 1.0, where each row defines one colour. MATLAB provides several predefined Colormaps such as ‘jet’, ‘hsv’, ‘hot’, ‘cool’, ‘spring’, ‘summer’, ‘autumn’, ‘winter’, ‘grey’, and more. You can set a Colormap using the ‘Colormap’ function, which affects the colours of surfaces, patches, and other graphics objects.
To set a Colormap, you call the ‘Colormap’ function with the name of the desired Colormap or a custom m-by-3 matrix. Here is an example of how to use a predefined Colormap:
|
% Create a sample matrix Z = peaks; % Create a surface plot surf(Z); % Set the colormap to 'hot' colormap(hot); colorbar; |
Get Current Colormap
In MATLAB, obtaining the current Colormap is useful when you need to analyse, modify, or save the Colormap being used in your visualisations. When called without arguments, the' Colourmap' function returns the current Colormap as an m-by-3 matrix, where each row corresponds to a colour defined by its red, green, and blue (RGB) components.
Knowing how to retrieve the current Colormap can help in various scenarios, such as adjusting the Colormap dynamically based on certain conditions or preserving the Colormap settings across different figures and sessions.
Here’s an example of how to get the current Colormap in MATLAB:
|
% Create a sample matrix Z = peaks; % Create a surface plot surf(Z); % Set the colormap to 'parula' colormap(parula); % Get the current colormap currentMap = colormap; % Display the current colormap disp(currentMap); |

Types of MATLAB Colormaps
MATLAB uses a diverse range of Colormaps to cater to different data visualization needs, enhancing the effectiveness of visualizations. Their understanding of the various types of Colormaps available can greatly enhance the effectiveness of their visualisations. Here is a list of the various Colormaps in MATLAB:
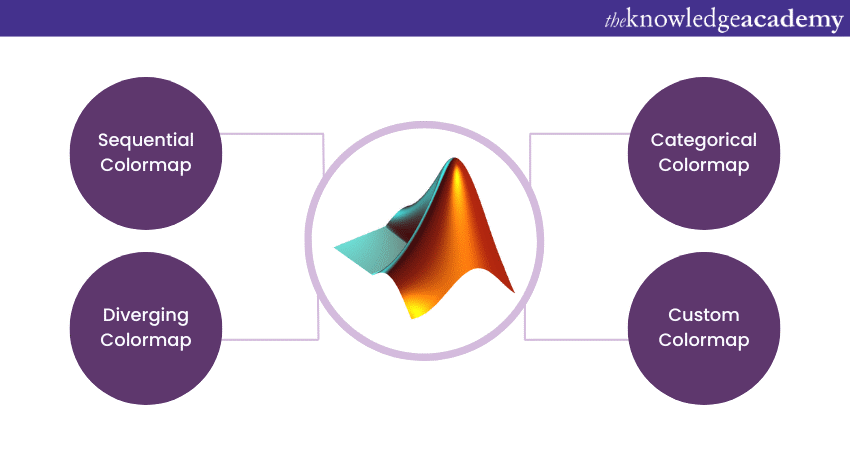
1) Sequential Colormap: Sequential Colormaps are suitable for representing ordered data with a natural progression. They smoothly transition from one colour to another, aiding in visualising data trends. Examples include "parula," which is the default MATLAB Colormap, "jet," "hot," and "viridis."
2) Diverging Colormap: Diverging Colormaps are ideal for visualising data with a critical midpoint or significant interest value. These Colormaps use two distinct colours that gradually transition into a third colour, indicating positive and negative deviations from the midpoint. Notable examples are "coolwarm," "bwr" (blue-white-red), and "seismic."
3) Categorical Colormap: Categorical Colormaps assign distinct colours to discrete or categorical data. They are helpful when visualising data with different groups or classes. MATLAB provides Colormaps such as "hsv," "lines," and "colorcube" for this purpose.
4) Custom Colormap: In addition to the predefined Colormaps, MATLAB allows users to create their own custom Colormaps. Users can design unique gradients that best represent their data by combining existing Colourmaps or defining specific colour values.
Choosing your Colormap
Choosing the right Colormap is crucial for developers to create compelling visualisations in MATLAB. The Colormap they select can significantly impact how their data is perceived and understood, especially when considering the Data Types in MATLAB and how different types of data are represented visually. Here are some key factors users can consider when choosing their Colormap:
a) Nature of the data: Consider your data's characteristics, such as continuous or categorical. Sequential Colormaps are often suitable for continuous data, as they convey smooth transitions and gradients. For categorical data, choose Colormaps that provide distinct colours for each category, ensuring clear differentiation.
b) Purpose of the Visualisation: Determine the goal of your visualisation. Are you highlighting patterns, emphasising differences, or focusing on specific values? Diverging Colormaps are effective when you have a critical midpoint or critical value to highlight. Sequential Colormaps work well for showing gradual changes. Categorical Colormaps are suitable for emphasising distinct groups.
c) Accessibility and Colourblind-friendly Considerations: Ensure your Colormap is accessible to all viewers, including those with colour vision deficiencies. Consider using perceptually uniform Colormaps and avoid relying solely on colour to convey information. Use colourblind-friendly Colourmaps or other visual cues, such as symbols or patterns, to enhance accessibility.
Furthermore, MATLAB's Features provide users with built-in functions to assist with Colormap selection. The "Colormap" function allows them to change the default Colormap for the current figure, while the "caxis" function enables them to adjust the range of colours displayed in the Colormap. More importantly, they can experiment with different Colormaps and adjust the Colormap range to enhance the visibility and interpretation of their data.
Learn about MATLAB and model data by signing up for the MATLAB Course now! now!
Creating your Custom Colormaps
The Advantage of MATLAB is that you can create your custom colour maps, allowing you to tailor the colour representation to your specific needs. Custom Colormaps can help you highlight aspects of your data or match specific visual preferences. Here's a step-by-step process to creating your custom Colormaps with a particular focus on MATLAB Convolution:
1) Determine the Colour Gradient: Decide on the desired colour progression for your Colormap. You can gradually transition between two colours or create a more complex gradient with multiple colours.
2) Generate Colour Values: MATLAB provides valuable functions like ‘linspace’ and ‘interp1’ to generate various colour values. Linspace generates evenly spaced values between two colours, while interp1 interpolates colours based on a set of given points.
3) Create the Colormap: Use the generated colour values to define your custom Colormap. MATLAB's Colormap function allows you to assign custom colours to your Colormap. Ensure that the Colormap has the correct colour values to match your data.
4) Test and Refine: Apply your custom Colormap to your Data Visualisation and assess its effectiveness. If necessary, adjust the colour values or progression to achieve the desired visual representation.
Tips to Create Custom Colormaps
Creating custom Colormaps in MATLAB allows you to tailor visualisations to your specific needs, enhancing the clarity and impact of your data presentations. Here are some essential tips for creating effective custom Colormaps:
a) Understand RGB Triplets: A Colormap in MATLAB is an m-by-3 matrix where each row is an RGB triplet. Values range from 0 to 1, representing the intensity of red, green, and blue. For example, [1 0 0] represents red, [0 1 0] represents green, and [0 0 1] represents blue.
b) Plan Your Colour Transitions: Decide how to map data values to colours. Smooth transitions are often more visually appealing and more accessible to interpret. For example, transitioning from blue to green to red can effectively highlight different data ranges.
c) Use linspace for Gradients: The linspace function helps create smooth gradients. For example, to create a gradient from blue to green, you can use:
|
blueToGreen = [linspace(0, 0, 100)', linspace(0, 1, 100)', linspace(1, 0, 100)']; |
d) Combine Segments for Complex Maps: For more complex Colormaps, combine multiple segments. For instance, to create a Colormap transitioning from blue to green to red, you can concatenate segments:
|
blueToGreen = [linspace(0, 0, 50)', linspace(0, 1, 50)', linspace(1, 0, 50)']; greenToRed = [linspace(0, 1, 50)', linspace(1, 0, 50)', linspace(0, 0, 50)']; customMap = [blueToGreen; greenToRed]; |
e) Ensure Perceptual Uniformity: A perceptually uniform Colormap changes constantly, making it easier to interpret data accurately. MATLAB's parula and Viridis are good examples of perceptually uniform Colormaps.
f) Test Your Colormap: Visualise your Colormap with actual data to ensure it enhances clarity and interpretability. Use a variety of plots (e.g., surface, contour) to see how the Colormap performs.
g) Save and Reuse: Once you create a custom Colormap, save it for future use:
|
save('customMap.mat', 'customMap'); |
Here’s a complete example of creating and applying a custom Colormap:
|
% Define custom colormap blueToGreen = [linspace(0, 0, 50)', linspace(0, 1, 50)', linspace(1, 0, 50)']; greenToRed = [linspace(0, 1, 50)', linspace(1, 0, 50)', linspace(0, 0, 50)']; customMap = [blueToGreen; greenToRed]; % Apply the custom colormap colormap(customMap); % Create a sample plot Z = peaks; surf(Z); colorbar; |
Conclusion
We hope from this blog you have understood everything about MATLAB Colormaps. They are powerful tools for developers to enhance their data interpretation and presentation. By understanding the various types of colormaps available, you can effectively represent data based on its nature and purpose.
Learn to analyse and manipulate data by signing up for the MATLAB & SPSS Training now!
Frequently Asked Questions
What are the Best Practices for Choosing a Colormap in MATLAB?
Choose Colormaps that enhance data readability, ensure perceptual uniformity, and avoid colour blindness issues. Use Colormaps like ‘parula’ or ‘viridis’ for general use.
What is the Purpose of a Colormap in Data Visualisation?
A Colormap translates numerical data into colours, enhancing the visual interpretation of complex datasets.
What are the Other Resources and Offers provided by The Knowledge Academy?
The Knowledge Academy takes global learning to new heights, offering over 3,000 online courses across 490+ locations in 190+ countries. This expansive reach ensures accessibility and convenience for learners worldwide.
Alongside our diverse Online Course Catalogue, encompassing 19 major categories, we go the extra mile by providing a plethora of free educational Online Resources like News updates, Blogs, videos, webinars, and interview questions. Tailoring learning experiences further, professionals can maximise value with customisable Course Bundles of TKA.
What is The Knowledge Pass, and How Does it Work?
The Knowledge Academy’s Knowledge Pass, a prepaid voucher, adds another layer of flexibility, allowing course bookings over a 12-month period. Join us on a journey where education knows no bounds.
What are Related Courses and Blogs Provided by The Knowledge Academy?
The Knowledge Academy offers various MATLAB & SPSS Training, including MATLAB Course and SPSS Masterclass. These courses cater to different skill levels, providing comprehensive insights into Basic MATLAB Commands.
Our Office Application Blogs cover a range of topics related to MATLAB, offering valuable resources, best practices, and industry insights. Whether you are a beginner or looking to advance your MATLAB skills, The Knowledge Academy's diverse courses and informative blogs have you covered.
Upcoming Office Applications Resources Batches & Dates
Date
 MATLAB Course
MATLAB Course
Fri 16th May 2025
MATLAB Course
Fri 11th Jul 2025
MATLAB Course
Fri 19th Sep 2025
MATLAB Course
Fri 21st Nov 2025
MATLAB Course
Fri 23rd Jan 2026
MATLAB Course
Fri 13th Mar 2026
MATLAB Course
Fri 22nd May 2026
MATLAB Course
Fri 24th Jul 2026
MATLAB Course
Fri 9th Oct 2026
 If you wish to make any changes to your course, please


