 Halloween sale! Upto 40% off - Grab now


 Top Rated Course

We may not have the course you’re looking for. If you enquire or give us a call on +44 1344 203 999 and speak to our training experts, we may still be able to help with your training requirements.
Power BI Semantic Model: A Complete Overview
Eliza Taylor 12 March 2024In this blog, we will explore Semantic Models and how to build them. Power BI Semantic Models create a unified and consistent view of your data, regardless of the source, format, or structure. They allow for the creation of business logic, relationships, calculations, and hierarchies applicable across reports and dashboards.

Training Outcomes Within Your Budget!
We ensure quality, budget-alignment, and timely delivery by our expert instructors.
Table of Contents

If you are working with data from different sources, such as databases, files, web services, or APIs, you may encounter challenges in integrating, transforming, and analysing them. For example, you may have to deal with inconsistent naming conventions, data types, formats, or granularity. This is where Power BI Semantic Models come in handy. This blog will delve into Semantic Models in BI and show how they work.
Table of Contents
1) What is a Semantic Model in Power BI?
2) Components of a Semantic Model
3) Optimal approaches for building a Semantic Model in Power BI
4) Management of Semantic Models
5) Advantages of Semantic Modelling
6) Disadvantages of Semantic Modelling
7) Conclusion
What is a Semantic Model in Power BI?
A Power BI Semantic Model is a collection of metadata describing your data's structure, meaning, and behaviour. It consists of three main components: tables, columns, and measures.
a) Tables are the logical containers of your data, which can be based on one or more data sources. They can have relationships with other tables based on common columns or keys.
b) Columns are the attributes or fields of your data, which can have different data types, formats, and properties. They can also be organised into hierarchies, such as date, time, geography, or product categories.
c) Measures are the calculations or expressions you can apply to your data, such as sums, averages, counts, ratios, or percentages. They can use columns, constants, or functions as inputs and have different aggregation or filtering behaviours.
A Semantic Model can be created and edited using Power BI Desktop. This free tool allows you to connect to various data sources, transform and model your data, and create interactive reports and dashboards. You can also use Power BI Service, a cloud-based platform that lets you publish, share, and collaborate on your reports and dashboards.

Components of a Semantic Model
A Power BI Semantic Model can have different components depending on the type and complexity of your data and analysis. Some of the common components are:
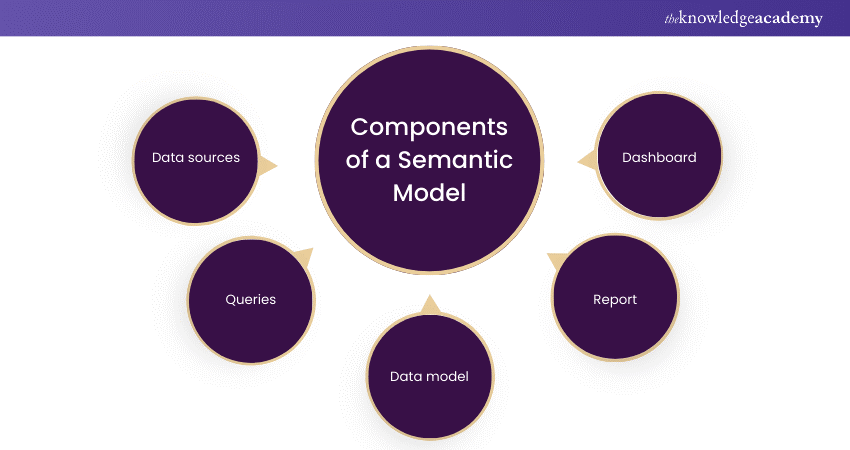
a) Data sources: These are the original sources of your data, such as databases, files, web services, or APIs. You can connect to multiple data sources and combine or append them.
b) Queries: These are the steps or transformations you apply to your data sources, such as filtering, sorting, merging, splitting, or pivoting. The Power Query Editor can perform these operations using a graphical interface or a scripting language called M.
c) Data model: This is the core component of your Semantic Model, where you define the tables, columns, relationships, and measures of your data. You can use the Data View or Model View to perform these tasks using a graphical interface or a scripting language called DAX.
d) Report: This is the component where you create the visualisations or charts that display your data, such as tables, matrices, graphs, maps, or slicers. You can use the Report View to perform this task using a drag-and-drop interface or a scripting language called R or Python.
e) Dashboard: This is the component where you create a summary or overview of your reports using tiles or widgets that show key metrics or insights. You can use the Power BI Service to perform this task using a drag-and-drop interface or a scripting language called Q&A.
Modes of Semantic Modelling
Depending on how you connect to your data sources and process and store your data, you can use different modes of Semantic Modelling in Power BI. Let’s explore them below:
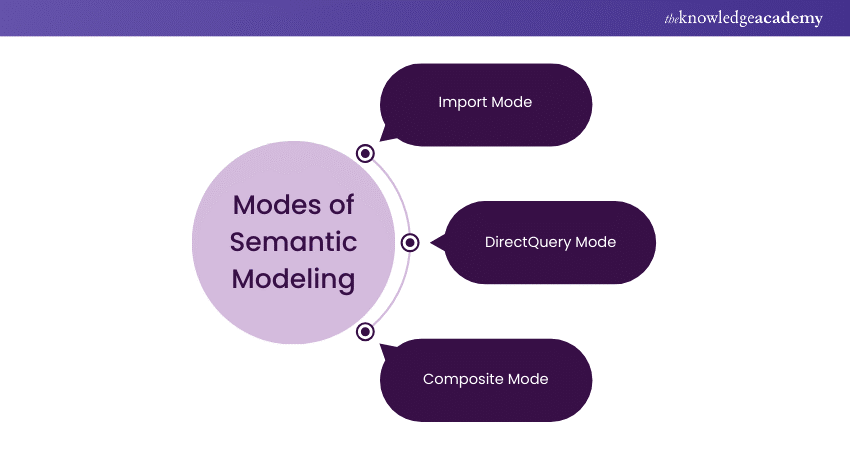
Import Mode
This is the default and most common mode of Semantic Modelling, where you import or load your data from your data sources into your Semantic Model. It means your data is stored in a compressed and optimised format, called the VertiPaq engine, part of the Power BI Desktop or Service.
This mode allows you to perform fast and complex calculations and analysis on your data without relying on the performance or availability of your data sources. However, this mode also means that your data is not automatically updated or refreshed unless you manually schedule or trigger it.
DirectQuery Mode
This is the mode of Semantic Modelling where you do not import or load your data from your data sources into your Semantic Model. Instead, you establish a live connection or query to your data sources and send the requests or queries from your reports or dashboards to your data sources.
It means that your data is always up-to-date and reflects the changes in your data sources. However, this mode also means that the performance or availability of your data sources limits your data. You may have restrictions or limitations on the transformations or calculations you can perform on your data.
Composite Mode
This is the mode of Semantic Modelling where you can combine or mix the import and DirectQuery modes and use them for different tables or data sources in your Semantic Model. It means that you can have the best of both worlds and leverage the advantages of each mode, depending on your data and analysis needs.
However, this mode also means you must deal with some challenges or complexities, such as managing the relationships, measures, and refresh policies between the different modes.
Learn the skills required to become a certified Power BI professional. Sign up for our Microsoft Power BI Course now!
Optimal approaches for building a Semantic Model in Power BI
Building a Power BI Semantic Model is not a one-size-fits-all process but a flexible and iterative one, where you can adapt and refine your model according to your data and analysis requirements. However, there are some general best practices or guidelines that you can follow to ensure that your Semantic Model is effective, efficient, and user-friendly. Some of these are:
Developing the Semantic Model workflow
Before you start building your Semantic Model, you should have a clear understanding of the purpose, scope, and audience of your model. You should also have a well-defined workflow or process outlining the steps or stages you will follow to create and maintain your model. A typical workflow may include the following steps:
a) Define the business problem or question you want to solve or answer with your data and analysis.
b) Identify the data sources and elements you need to access and use for your analysis.
c) Choose the mode of Semantic Modelling that best suits your data and analysis needs, whether import, DirectQuery, or composite.
d) Connect to your data sources and perform the necessary transformations or queries to prepare and shape your data.
e) Create and edit your data model, and define the tables, columns, relationships, and measures of your data.
f) Create and edit your report and design the visualisations or charts that display your data.
g) Create and edit your dashboard and create the tiles or widgets summarising your data.
h) Publish and share your Semantic Model, report, and dashboard with your end-users or stakeholders and collect their feedback or suggestions.
i) Monitor and update your Semantic Model, report, and dashboard, and ensure they are accurate, relevant, and reliable.
Selecting the appropriate data granularity
One of the key decisions you must make when building your Semantic Model is the level of detail or granularity you want to use for your data. This refers to the amount of information or attributes you include or exclude for each record or row of your data. For example, you can have a high level of granularity, where you include many details or attributes, such as date, time, location, product, customer, sales, or profit. Or, you can have a low level of granularity, where you include fewer details or attributes, such as month, region, category, or revenue.
The level of granularity that you choose for your data can significantly impact the size, performance, and usability of your Semantic Model. Therefore, you should consider the following factors when selecting the appropriate data granularity:
a) The type and complexity of your data sources and data elements. For example, suppose you have large or complex data sources, such as big data or unstructured data. In that case, you may want to use a lower level of granularity to reduce the amount of data you have to import, process, or query. On the other hand, if you have small or simple data sources, such as files or tables, you may want to use a higher level of granularity to preserve the quality and richness of your data.
b) What is the mode of Semantic Modelling that you use for your data? For example, if you use the import mode, you may want to use a lower level of granularity to reduce the size and increase the performance of your Semantic Model. On the other hand, if you use the DirectQuery mode, you may want to use a higher level of granularity to avoid the limitations or restrictions on the transformations or calculations you can perform on your data.
c) The type and complexity of your analysis and reporting needs. For example, suppose you must perform simple or aggregated analyses, such as totals, averages, or trends. In that case, you may want to use a lower level of granularity to simplify and standardise your data. On the other hand, if you need to perform complex or detailed analysis, such as drill-downs, filters, or slices, you may want to use a higher-level
Enhancing performance through Semantic Model optimisation
Another important aspect of building your Semantic Model is the performance or speed of your data processing, calculation, and visualisation. This refers to how fast or slow your Semantic Model can load, refresh, query, or display your data, depending on the size, complexity, and mode of your data and analysis. Your Semantic Model's performance can significantly impact the user experience and satisfaction of your end-users or stakeholders. Therefore, you should consider the following factors when optimising the performance of your Semantic Model:
a) The size and structure of your data model. For example, you should try to reduce the number of tables and columns in your data model and use the smallest possible data types and formats for your columns. You should also try to avoid or minimise calculating columns and use measures instead. You should also try to create and maintain simple and efficient relationships between your tables and use the star or snowflake schema whenever possible.
b) The complexity and efficiency of your measures and calculations. For example, you should try using simple and standard DAX functions and expressions for your measures and calculations. Additionally, avoid or minimise using complex or custom ones. You should also try to use variables and constants in your measures and calculations and avoid or minimise using iterators or filters. You should also try to use context transitions, calculate modifiers wisely and avoid or minimise the use of time intelligence or dynamic functions.
c) The design and layout of your report and dashboard. For example, you should use simple and clear visualisations or charts for your report and dashboard and avoid or minimise the use of complex or custom ones. You should also try to use the appropriate visual-level filters and slicers for your report and dashboard and avoid using page-level or report-level filters and slicers. You should also try to use the optimal size and resolution for your report and dashboard and avoid or minimise the use of images or backgrounds.
Elevate your analytics game with Microsoft BI Training today!
Management of Semantic Models
Once you have built your Semantic Model, you should also have a plan or strategy for managing and maintaining it. It refers to ensuring that your Semantic Model is secure, reliable, and up-to-date and meets the expectations and needs of your end-users or stakeholders. Some of the common tasks or activities that you may have to perform for managing your Semantic Model are:
Refreshing your Semantic Model
This is the process of updating or synchronising your Semantic Model with your data sources and ensuring that your data is current and accurate. You can refresh your Semantic Model manually or automatically, depending on the mode of Semantic Modelling you use and the frequency and schedule you set. You can also use incremental or partial refresh, which allows you to update only a subset or portion of your data and improve the performance and efficiency of your refresh process.
Securing your Semantic Model
This is the process of protecting your Semantic Model from unauthorised access or modification and ensuring that your data is confidential and safe. You can secure your Semantic Model using different methods or techniques, such as encryption, authentication, authorisation, or auditing. You can also use row-level or dynamic security, which allows you to restrict or filter the data your end-users or stakeholders can see or access based on their roles or identities.
Monitoring your Semantic Model.
This is the process of tracking or measuring your Semantic Model's performance, usage, and health and ensuring that your data is available and reliable. You can monitor your Semantic Model using different tools or features, such as Power BI Service, Power BI Premium, Power BI Report Server, or Power BI Admin Portal. You can also use metrics or indicators, such as refresh duration, query duration, memory usage, CPU usage, or error rate, to evaluate or troubleshoot your Semantic Model.
Advantages of Semantic Modelling
Semantic Modelling in Power BI has many advantages or benefits, both for the Data Analysts or developers who create the Semantic Models and for the end-users or stakeholders who consume the Semantic Models. Some of these advantages are:
a) It simplifies and standardises the data integration, transformation, and analysis by providing a consistent and unified view of the data, regardless of the source, format, or structure.
b) It enhances the data quality and accuracy by allowing the Data Analysts or developers to define the data's business logic, relationships, calculations, and hierarchies and perform data validation and verification.
c) It improves the data performance and scalability by allowing the Data Analysts or developers to choose the optimal mode of Semantic Modelling and to apply various optimisation techniques or best practices to the data model, measures, and visualisations.
d) It increases the data usability and accessibility by allowing the end-users or stakeholders to interact with the data easily and intuitively, using various reports and dashboards and performing self-service or ad-hoc analysis using natural language or Artificial Intelligence.
Disadvantages of Semantic Modelling
Semantic Modelling in Power BI also has disadvantages or drawbacks, both for the Data Analysts or developers who create the Semantic Models and for the end-users or stakeholders who consume the Semantic Models. Some of these disadvantages are:
a) Data Analysts or developers require a high level of skill and expertise to create and maintain Semantic Models and use various tools or languages, such as Power Query, DAX, R, or Python.
b) It involves a high level of complexity and effort by the Data Analysts or developers to manage and update the Semantic Models and to deal with the various challenges or issues, such as data refresh, security, or performance.
c) It poses a high level of risk and dependency by the end-users or stakeholders on the Semantic Models and the Data Analysts or developers who create and maintain them. Any error or change in the Semantic Models can affect the data quality, accuracy, or reliability.
Here is the table that summarises the advantages and disadvantages of Semantic Modelling in Power BI:

Unlock actionable insights today with our Business Intelligence Reporting Courses - Elevate your decision-making!
Conclusion
Power BI Semantic Models are a powerful and flexible way of creating a layer of abstraction between your data sources and your reports and dashboards, where you can define your data's meaning, context, and logic. By using Semantic Models, you can simplify and standardise your data and make it easier for your end-users to understand and consume.
To know more about identifying and connecting to data sources in Power BI, join our Microsoft Power BI Data Analyst PL300 Course.
Frequently Asked Questions
What is the difference between a Semantic Model and a data warehouse?

A Semantic Model is a collection of metadata that describes the structure, meaning, and behaviour of your data. On the other hand, a data warehouse is a physical storage system that stores and organises your data.
How can I share or collaborate on my Semantic Model with other users or developers?
You can share or collaborate on your Semantic Model with other users or developers by using the Power BI Service, which is a cloud-based platform that allows you to publish, share, and collaborate on your reports and dashboards. Additionally, you can use Power BI Premium or Power BI Report Server and Power BI Desktop.
What are the other resources and offers provided by The Knowledge Academy?
The Knowledge Academy takes global learning to new heights, offering over 30,000 online courses across 490+ locations in 220 countries. This expansive reach ensures accessibility and convenience for learners worldwide.
Alongside our diverse Online Course Catalogue, encompassing 17 major categories, we go the extra mile by providing a plethora of free educational Online Resources like News updates, Blogs, videos, webinars, and interview questions. Tailoring learning experiences further, professionals can maximise value with customisable Course Bundles of TKA.
What is the Knowledge Pass, and how does it work?
The Knowledge Academy’s Knowledge Pass, a prepaid voucher, adds another layer of flexibility, allowing course bookings over a 12-month period. Join us on a journey where education knows no bounds.
What are related courses and blogs provided by The Knowledge Academy?
The Knowledge Academy offers various Business Intelligence Reporting Courses, including Microsoft Power BI Course, Tableau Desktop Training, and DAX Training. These courses cater to different skill levels, providing comprehensive insights into Power BI Slicers.
Our Office Applications Blogs cover a range of topics related to Power BI, offering valuable resources, best practices, and industry insights. Whether you are a beginner or looking to advance your Power BI skills, The Knowledge Academy's diverse courses and informative blogs have you covered.
Upcoming Microsoft Technical Resources Batches & Dates
Date
 Microsoft Power BI Course
Microsoft Power BI Course
Wed 6th Nov 2024
Microsoft Power BI Course
Wed 20th Nov 2024
Microsoft Power BI Course
Wed 4th Dec 2024
Microsoft Power BI Course
Wed 11th Dec 2024
Microsoft Power BI Course
Wed 18th Dec 2024
Microsoft Power BI Course
Wed 15th Jan 2025
Microsoft Power BI Course
Wed 5th Feb 2025
Microsoft Power BI Course
Wed 12th Mar 2025
Microsoft Power BI Course
Wed 9th Apr 2025
Microsoft Power BI Course
Wed 21st May 2025
Microsoft Power BI Course
Wed 11th Jun 2025
Microsoft Power BI Course
Wed 16th Jul 2025
Microsoft Power BI Course
Wed 6th Aug 2025
Microsoft Power BI Course
Wed 10th Sep 2025
Microsoft Power BI Course
Wed 8th Oct 2025
Microsoft Power BI Course
Wed 12th Nov 2025
Microsoft Power BI Course
Wed 3rd Dec 2025
 If you wish to make any changes to your course, please


