We may not have the course you’re looking for. If you enquire or give us a call on +48 221041849 and speak to our training experts, we may still be able to help with your training requirements.
Training Outcomes Within Your Budget!
We ensure quality, budget-alignment, and timely delivery by our expert instructors.

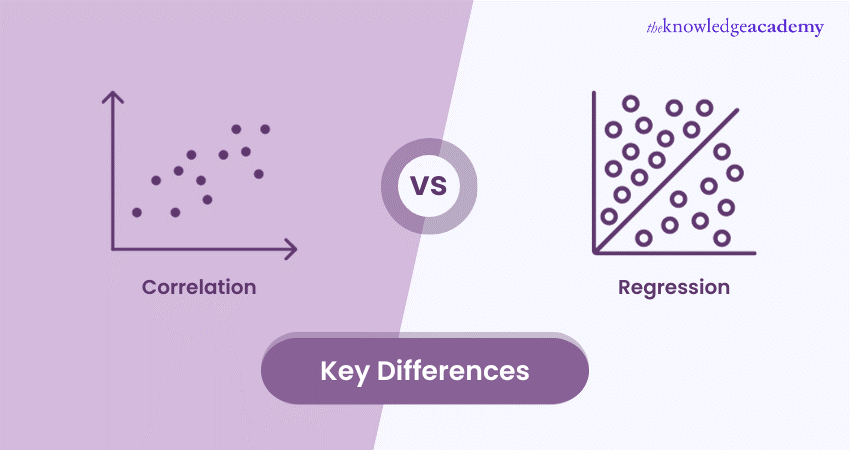
In this age, where data is so abundantly being generated, there are statistical techniques that break these datasets down into variables to help us understand them. To understand how the statistical tools help us understand these variables, we need to understand the critical difference between Correlation vs Regression.
While both are essential tools in the field of statistics, they serve different purposes and offer unique insights. In this blog, you are going to learn about the differences between Correlation vs Regression, how they are similar to each other and how they are helping businesses and research.
Table of Contents
1) What is Correlation?
2) What is Regression?
3) Critical differences between Correlation vs Regression
4) Similarities between Correlation and Regression
5) Conclusion
What is Correlation?
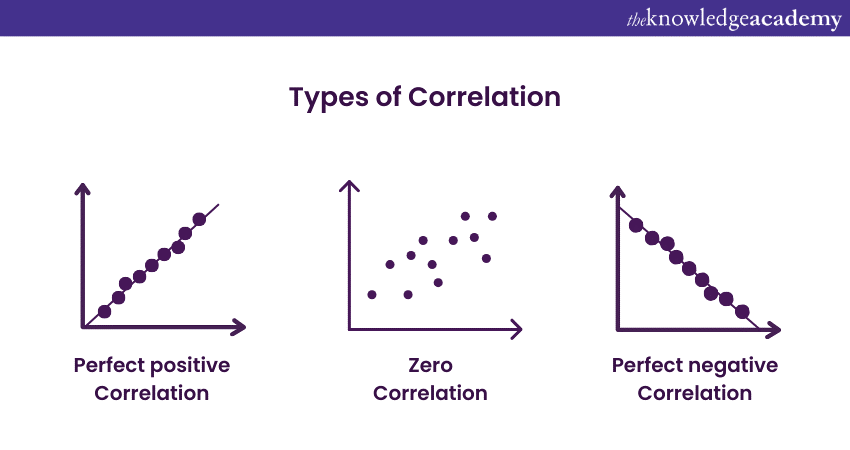
Correlation is a statistical measure that gauges the strength and direction of a relationship if it exists between two variables. It quantifies the extent to which changes in one variable correspond to changes in another, offering valuable insights into patterns within data sets. The Correlation coefficient, often denoted as 'r', ranges from -1 to +1.
A positive Correlation (ranging from 0 to +1) signifies a direct relationship: as one variable increases, so does the other. Conversely, a negative Correlation (ranging from 0 to -1) indicates an inverse relationship: as one variable increases, the further decreases. There can also be zero Correlation between the two variables. This Correlation signifies that there is a null relationship between them. It is in this Correlation when a change in one variable does not affect the other. The following image will help you to understand them better:

Get empowered with Business Analysis Skills with our Introduction to Statistics Course. Join now!
What is Regression?

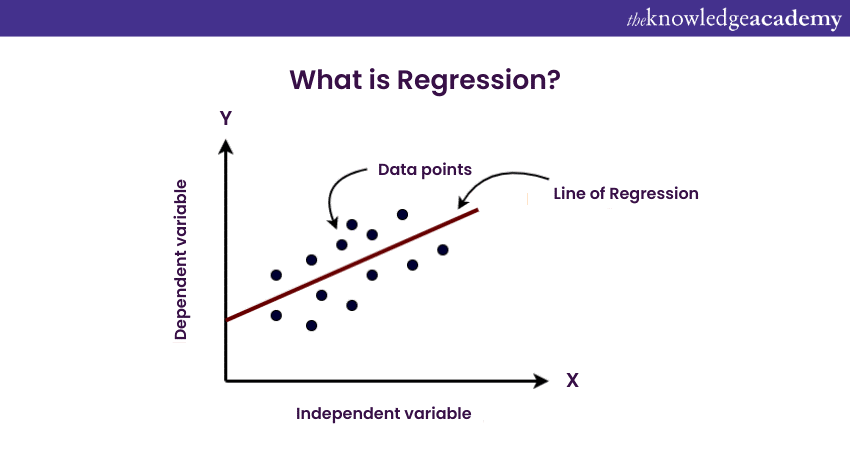
Regression helps in understanding the underlying structure of the data by fitting a mathematical model to observed points. Regression Analysis comes in different forms, such as linear and non-linear Regression, allowing statisticians and researchers to choose the most appropriate model for their specific data.
By deciphering intricate relationships and predicting future outcomes, Regression empowers decision-makers across diverse fields, making it a cornerstone of predictive analytics and informed decision-making processes. It goes a step further by formulating a precise equation that can predict the value of one variable based on the importance of others. This predictive power makes Regression invaluable in forecasting and trend analysis.
Transform your financial insights with our Regression Analysis Training. Sign up now!
Key differences between Correlation vs Regression
Correlation and Regression, though related, serve different purposes in the field of statistics. Understanding their fundamental differences is vital for accurate data interpretation and informed decision-making. In this section, we will dissect the difference between Correlation and Regression, shedding light on their distinct methodologies, interpretations, and applications.
|
Aspect |
Correlation |
Regression |
|
Purpose |
Measures strength and direction of the relationship |
Predicts and models the relationship |
|
Variables |
Two variables (equal roles) |
Independent and dependent variables |
|
Calculation |
Correlation coefficient (r) |
Regression equation (y = mx + b) |
|
Direction |
+1 to -1 (positive, negative, no Correlation) |
Positive, negative (strength and direction) |
|
Causation |
It does not imply causation |
Can imply causation under controlled conditions |
|
Handling outliers |
Relatively robust |
Sensitive outliers can distort the Regression line |
|
Data representation |
Single coefficient |
The equation representing the relationship |
|
Application |
Descriptive, identifies patterns |
Predictive, forecasts future values |
|
Complexity |
Simple method |
Variable complexity (simple to multivariate) |
|
Interpretation |
Limited to strength and direction |
Detailed insights into the relationship |
|
Hypothesis testing |
Limited to Correlation significance |
Tests coefficients' importance in the model |
|
Time-series analysis |
Limited predictive power |
Helpful in forecasting future trends |
|
Usage |
Preliminary analysis, identifies associations |
Prediction, modelling, understanding impact |
Statistical purpose and goals
Correlation primarily aims to assess the strength and direction of the relationship between two variables. It helps in determining whether and how strongly variables are related without implying causation. Correlation coefficients, represented by 'r', range from -1 to +1, where +1 indicates a perfect positive Correlation, -1 represents an ideal negative Correlation, and 0 indicates no Correlation.
Regression, on the other hand, not only evaluates the relationship between variables but also formulates a predictive model. It aims to understand how the change in one variable affects another, allowing for predictions based on this understanding. The Regression equation derived from the data enables forecasting and is used for modelling and making predictions about future observations.
Nature of variables involved
In Correlation, the variables involved are treated equally, without distinguishing between independent and dependent variables. It also measures the degree of association between two variables, regardless of their roles in the relationship.
On the contrary, in Regression, variables are categorised as independent (predictor) and dependent (response) variables. The independent variable(s) are used to predict the values of the dependent variable. Regression Analysis provides insights into how changes in the independent variables affect the dependent variable, offering a predictive framework for decision-making.
Calculation and interpretation
Correlation coefficients are calculated using formulas such as Pearson's, Spearman's, or Kendall's Correlation coefficients. These coefficients indicate the strength and direction of the relationship between variables. Positive values signify positive Correlation, negative values indicate negative Correlation, and zero represents no Correlation.
However, Regression Analysis involves complex calculations to determine coefficients and constants in the Regression equation. The process includes minimising the sum of squared differences between observed and predicted values. The Regression equation (y = mx + b) represents the relationship between variables. In this equation, 'y' means the dependent variable, 'x' symbolises the independent variable, 'm' is the slope, and 'b' is the intercept.
Use cases and applications
Correlation is employed when researchers want to understand the nature and strength of relationships between variables without making predictions. It is widely used in fields like psychology, biology, and economics to identify patterns and dependencies between variables. For instance, psychologists might use Correlation to explore the relationship between study time and exam scores to understand academic performance patterns.
Regression, on the other hand, is applied when the goal is to predict outcomes and also understand the impact of changes in independent variables on the dependent variable. It finds applications in fields such as finance, engineering, and healthcare. Financial analysts, for example, use Regression to predict stock prices based on historical data, aiding investment decisions.
Limitations and assumptions
Both Correlation and Regression have their limitations and assumptions. Correlation does not imply causation; a strong Correlation between two variables does not mean one causes the other. Additionally, Correlation coefficients can be influenced by outliers, affecting the accuracy of the Correlation analysis.
On the other hand, Regression assumes a linear relationship between variables, which might not always be the case. Nonlinear relationships require nonlinear Regression techniques, adding complexity to the analysis. Moreover, Regression Analysis is sensitive to outliers and multicollinearity (high Correlation between independent variables), which can affect the reliability of the Regression model.
Strengths and weaknesses
Correlation analysis is straightforward and provides a precise measure of the relationship's strength and direction. It is helpful for preliminary analysis identifying potential patterns in the data. However, it lacks the predictive power of Regression and cannot be used for making future projections.
Regression Analysis, on the other hand, offers predictive capabilities, allowing for the estimation of future values based on historical data. It provides important insights into the impact of independent variables on the dependent variable. However, it requires a deeper understanding of the data and underlying assumptions, making it more complex than Correlation analysis.
Direction vs. prediction
Correlation merely indicates the direction and strength of a relationship between variables. It answers questions like whether two variables increase or decrease together. Regression, on the other hand, not only reveals the direction but also predicts the magnitude of change in one variable concerning changes in another. It can answer questions like how much the dependent variable is expected to change for a unit change in the independent variable.

Causality vs. association
Correlation does not mean causation. Even though two variables are strongly correlated, it still does not mean that changes in one variable cause changes in the other. Regression, while not proving causation, can establish a causal relationship under controlled experimental conditions. It can show whether changes in the independent variable directly impact the dependent variable.
Representation of data
Correlation analysis results in a single value, the Correlation coefficient, which summarises the relationship between variables. It doesn't provide an equation or model representing the data. In contrast, Regression Analysis provides a mathematical equation (linear or nonlinear) that can represent the relationship between variables. This equation is a valuable tool for making predictions and understanding the relationship intuitively.
Homoscedasticity and heteroscedasticity
Correlation analysis does not assume homoscedasticity (equal variance of residuals) between variables. In Regression, homoscedasticity is an essential assumption for accurate predictions. If the variance of residuals (the differences between observed and predicted values) is consistent across all levels of the independent variable, the Regression model is homoscedastic. Heteroscedasticity (varying variance) can lead to unreliable predictions, affecting the Regression model's accuracy.
Multivariate analysis
While Correlation is typically used for bivariate analysis (involving two variables), Regression can be extended to multivariate analysis, involving more than two variables. Multiple Regression considers multiple independent variables, allowing for a more complex analysis of the relationships between variables. It enables the examination of how several predictors collectively influence the outcome variable, offering a more comprehensive understanding of the data.
Assumptions of normality
Regression Analysis often assumes that the residuals (the differences between observed and predicted values) are typically distributed. This assumption is crucial for hypothesis testing and confidence intervals. Correlation analysis, being a non-parametric method for measuring association in variables, does not rely on this assumption. Therefore, Correlation can be a preferred method when the normality assumption is in question.
Interpretation of coefficients
In Regression, the coefficients of independent variables provide valuable insights into the relationships. For instance, in a linear Regression equation, a positive coefficient indicates that the dependent variable increases as the corresponding independent variable increases. The size of the coefficient quantifies the magnitude of this change. Correlation, being a single number, does not provide this detailed interpretation of the relationship.
Handling missing data
Correlation analysis can handle missing data by excluding pairs of observations with missing values. Regression Analysis, especially when involving multiple variables, requires careful handling of missing data. Techniques like multiple imputation or specific Regression methods designed for missing data are often applied to ensure the accuracy of Regression results.
Handling non-numeric data
Correlation specifically deals with numeric variables. It quantifies the linear relationship between two numerical variables. Regression, however, can handle both numerical and categorical (non-numeric) variables. Techniques like dummy coding or one-hot encoding are employed to convert categorical variables into a format suitable for Regression Analysis.
Predictive accuracy
Regression is focused on predictive accuracy. Regression models are optimised to minimise the difference between observed and predicted values. In contrast, Correlation does not aim for predictive accuracy. It is more concerned with describing the strength and direction of the relationship rather than accurately predicting future values.
Treatment of outliers
Outliers, or extreme values, can significantly influence both Correlation and Regression. However, Regression is more sensitive to outliers than Correlation. An outlier in Regression Analysis can distort the Regression line, affecting the accuracy of predictions. Correlation, being a rank-based measure in some cases (like Spearman’s Correlation), is relatively robust to outliers.
Handling non-linear relationships
Regression can capture non-linear relationships through techniques like polynomial Regression or non-linear Regression models. It can model curves and complex patterns in the data. On the other hand, Correlation, being primarily focused on linear relationships, might not capture the nuances of non-linear associations between variables effectively.
Model complexity
Regression models can vary in complexity. Simple linear Regression involves one independent variable, while multiple Regression incorporates several predictors. Additionally, Regression Analysis can include interaction terms, allowing for the examination of how the relationship between variables changes based on the values of other variables. Correlation, however, being a single coefficient, is conceptually more straightforward and needs to account for these complexities.
Basis of hypothesis testing
Regression Analysis allows for hypothesis testing related to the coefficients of the independent variables. Analysts can test whether specific variables significantly contribute to the model. Correlation, on the other hand, does not involve hypothesis testing directly related to the Correlation coefficient itself. The importance of Correlation coefficients can be tested, but it does not provide the same depth of insight into the relationship as Regression.
Interested to learn Data Science and Analytics? Then sign up now for our specialised course on Data Science Analytics. Unlock your potential now!
Similarities between Correlation and Regression
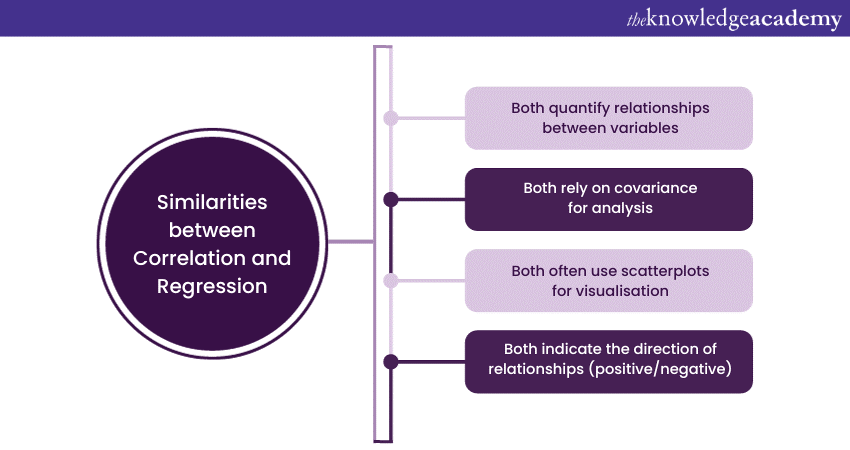
While Correlation and Regression differ significantly in their goals and methodologies, they share several fundamental similarities in their statistical foundation and applications.

Both measure relationships
Both Correlation and Regression aim to quantify relationships between variables. Correlation assesses the strength and direction of linear relationships, providing a numerical measure (Correlation coefficient) that ranges from -1 to +1. Regression, while also evaluating relationships, goes further by estimating the impact of changes in one variable on another through Regression coefficients.
Dependence on covariance
Both Correlation and Regression rely on covariance, which measures how two variables change together. Covariance serves as a foundational concept, allowing statisticians to understand the direction of the relationship. Correlation, in particular, is essentially a normalised version of covariance, providing a standardised measure of association.
Utilise scatterplots
Both Correlation and Regression often employ scatterplots as visualisation tools. Scatterplots help depict the relationship between variables graphically, providing a visual representation of patterns that can aid in understanding the nature of the Correlation or Regression.
Interpretation of direction
In both Correlation and Regression, the sign, whether it is positive or negative, shows the direction of the relationship. A positive sign signifies a positive Correlation or a positive Regression coefficient, meaning that as one variable increases, the other tends to increase as well. Conversely, a negative sign indicates a negative Correlation or a negative Regression coefficient, suggesting that as one variable increases, the other decreases.
Conclusion
We hope that you have learnt the differences between Correlation vs Regression. With these differences in mind, you can now implement them accordingly to understand the amount of data that is generated every day. Understanding these shared aspects and overall comprehension of both Correlation and Regression will help you in your analysis.
Empower your career in data-driven decision-making with our Big Data and Analytics Training. Join now!
Frequently Asked Questions
Upcoming Data, Analytics & AI Resources Batches & Dates
Date
 Regression Analysis Training
Fri 7th Mar 2025
Fri 2nd May 2025
Fri 4th Jul 2025
Fri 5th Sep 2025
Fri 7th Nov 2025


 Top Rated Course


 If you wish to make any changes to your course, please


