


 Top Rated Course

We may not have the course you’re looking for. If you enquire or give us a call on +46 850282424 and speak to our training experts, we may still be able to help with your training requirements.
How to Use Excel? A Step-by-Step Guide
Gracey Smith 09 April 2025This blog will take you through the world of Excel mastery. From creating dynamic spreadsheets to harnessing the full potential of formulas, it includes every detail one can look for. Let's explore this blog to learn How to Use Excel. It will help you gain hands-on experience, boost your spreadsheet skills, and enhance your Excel efficiency.
Training Outcomes Within Your Budget!
We ensure quality, budget-alignment, and timely delivery by our expert instructors.
Table of Contents
What is Microsoft Excel? What is Excel Used for?Basic Excel FormulasHow to Create an Excel Spreadsheet? How to Save an Excel File?How to Add Data to Your Spreadsheet? How to Format Data in Excel?How to Create a Table in Excel? How to Sort Your Data? How to Filter Your Data? How to use Formulas in Excel?How to Make a Pivot Chart in Excel?How to Create a Chart from a Pivot Table?How to Print Your Work? Conclusion

Worldwide users across industries, such as finance, accounting, marketing and other professions use Excel. Its robust features and intuitive interface handle tasks like simple calculations, complex data analysis, and reporting. By mastering How to Use Excel, you can streamline workflows, improve productivity, and gain valuable insights from your data.
Hence, this step-by-step blog on How to Use Excel attempts to give you an extensive understanding of its features. It will provide you with tips, tricks, and best practices to maximise your efficiency and productivity in Excel. Without any delay, let's delve in to discover the intricacies of Excel and enhance your spreadsheet proficiency.
Table of Contents
1) What is Microsoft Excel?
2) What is Excel Used for?
3) Basic Excel Formulas
4) How to Create an Excel Spreadsheet?
5) How to Save an Excel File
6) How to add Data to your Spreadsheet?
7) How to Format data in Excel
8) How to Create a table in Excel
9) How to Sort your Data?
10) How to Filter your Data?
11) How to use Formulas in Excel?
12) How to Make a Pivot Chart in Excel?
13) How to Create a Chart from a Pivot Table?
14) How to Print Your Work?
15) Conclusion
What is Microsoft Excel?
Microsoft Excel serves a diverse function by managing data and providing users with numerous features. At its essence, it helps users create spreadsheets by offering a structured space to arrange and save data. Excel goes beyond just storing data, offering a wide range of features designed specifically for analyzing and manipulating data. Whether it's converting TSV to Excel or working with other data formats, it provides a user-friendly interface for effectively managing information, whether it is numerical data, text, dates, or formulas.
Moreover, Excel offers graphing tools that empower users to visualise data trends and patterns. As a whole, it facilitates deeper insights and informed decision-making.

What is Excel Used for?
Microsoft Excel is used for various purposes, including:
a) Data Organisation: Excel enables users to organise data efficiently into columns and rows while also allowing for data manipulation through features like Comparison of Two Columns, as well as hiding and unhiding of columns and Removing Blank Rows in Excel.
b) Calculations: It supports various mathematical functions and formulas, enabling users to perform complex calculations
c) Data Analysis: Excel is often used for data analysis, and features like pivot tables help summarise and analyse large data sets1.
d) Financial Modeling: Businesses use Excel for financial modeling, budgeting, forecasting, and Excel bookkeeping to efficiently manage and track financial data.
e) Charting and Graphing: Users can create various charts and graphs to visualise data
f) Project Management: Excel can create schedules, track project progress, and manage resources
g) Reporting: It is commonly used to generate reports and dashboards for business intelligence
Basic Excel Formulas
The basic Excel formulas act as building blocks for performing various calculations and operations within spreadsheets. Let's take a look at some of those formulas:
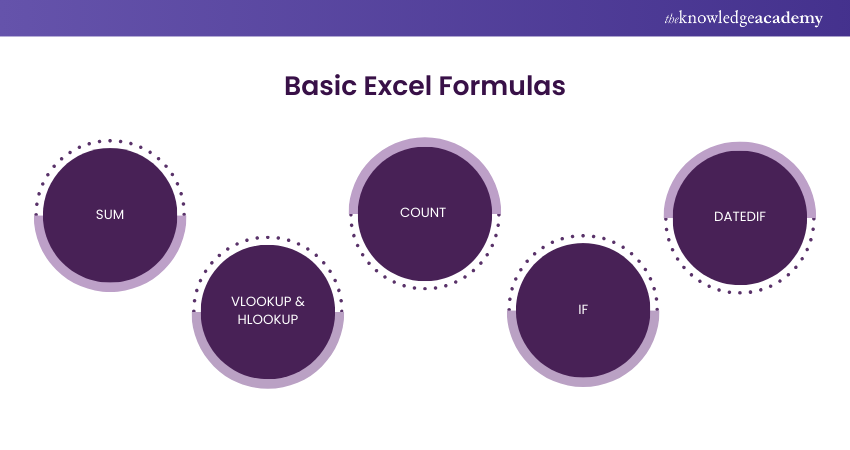
SUM
The SUM formula adds up the values in a range of cells. For example, =SUM(A1:A10) would add up the values in cells A1 through A10.
COUNT
The COUNT function tallies the number of cells within a specified range with numerical values. For example, =COUNT(A1:A10) calculates the number of cells within the range of A1 to A10 that hold numerical values.
DATEDIF
This function computes the disparity between two dates, measuring it in terms of days, months, or years. For example, =DATEDIF(A1, A2, "d") would calculate the number of days between the dates in cells A1 and A2.
Enhance your accounting skills with our Excel for Accounting Course - register today!
VLOOKUP & HLOOKUP
The VLOOKUP and HLOOKUP formulas are used to look up and retrieve data from a table. VLOOKUP scans the initial column of a table to locate a specified value and retrieves a corresponding value from a different column. HLOOKUP works similarly but searches for a value in the first row of a table.
IF
The IF formula evaluates a logical condition and provides a specific output if the condition is met and an alternative output if it is not. For instance, if the value in cell A1 surpasses 10, the formula =IF(A1>10, "Yes", "No") will yield "Yes"; otherwise, it will produce "No".
How to Create an Excel Spreadsheet?
Creating an Excel spreadsheet is the first step towards organising and managing your data effectively. Here's how to get started:
a) Open Excel and click on "Blank Workbook" to initiate a new spreadsheet
b) Personalise the layout, design, and formatting based on your preferences and needs
How to Save an Excel File?
When using Excel online, your work is automatically saved as you go. However, if you want to save your workbook as a new file, you can do so by following these steps:
1) Click on "File."
2) Select "Save As" and "Save a Copy." If you're using the desktop app, you only need to click "Save As."
3) Rename your file and choose where to store it. If you're using Excel online, you can only save it in OneDrive as a .xlsx file. However, if you're using the desktop app, you can store it in OneDrive or save it on your computer in various formats, such as .xls, .xlsx, and .csv. For a quick reference on file formats and saving options, check out our Excel Cheat Sheet.
4) Finally, click "Create a Copy" (online) or "Save" (desktop app).
How to Save an Excel File as a PDF?
The steps for saving an Excel file as a PDF vary depending on whether you're using the online or desktop version of the application. Here, we will discuss both.
How to Save an Excel File as a PDF Using Excel Online?
1) Click on "File,"
2) Choose "Export" and select "Download as PDF."
That's it! Your workbook will be saved as a PDF on your computer.
How to Save an Excel File as a PDF Using the Desktop App?
1) Click "File" and select "Save As".
2) Rename your file.
3) Click the dropdown next to "File Format" and choose "PDF".
4) By default, Excel saves the entire workbook. You can change this to save only a specific sheet or selection of your workbook.
5) Finally, click "Save".
How to Add Data to Your Spreadsheet?
Adding data to an Excel spreadsheet is a fundamental aspect of using the software. Let's take a look at how to add data to your spreadsheet:
a) Right-click on a cell and input data.
b) Enter text, numbers, dates, or formulas into cells.
c) Utilise the tab key to navigate to the next cell or arrow keys for movement within the spreadsheet.
Dive into a transformative journey towards mastering Excel - join our Business Analytics With Excel Course now!
How to Format Data in Excel?
Once you have imported data from another source or entered it manually, you will likely need to adjust, format, and sometimes use Splitting Cells in Excel to present it more clearly in your spreadsheet for improved readability.
How to Navigate the Excel Ribbon?
The Excel ribbon is the principal place to find all the program's tools and features. It is divided into tabs: Home, Insert, Page Layout, Formulas, Data, Review, and View. Each tab focuses on a specific aspect of Excel, making it easier to find the tools you need, such as the options to Convert PDF to Excel.
The Excel ribbon is like a menu divided into sections called tabs, including the MS Excel View Tab. Each tab is organized based on what it does. Above the ribbon, there's the Quick Access Toolbar, which lets you quickly use commands you use a lot. You can even change it to fit your needs. Knowing your way around the tabs, groups, and Quick Access Toolbar in Excel can help you get things done faster.
How to Format Text and Data in Excel?
Formatting text and data in Excel is crucial for creating professional, easy-to-read spreadsheets. Here's a concise guide:
Text Formatting:
a) Font Style and Size: Select text, go to the Home tab, choose font style and size, and apply bold, italics, or underline.
b) Text Alignment: Adjust text alignment and colour in the Font group.
Formatting Data:
a) Number Formats: Format data such as currency, percentages, dates, etc., in the Number group.
b) Conditional Formatting: Highlight data trends using colour scales, data bars, or custom rules in the Styles group.
c) Cell Borders and Shading: Add borders and shading using the Borders and Fill Color options.
How to Merge Cells in Excel?
1) Select the cells to be merged by clicking and dragging or using the Shift and arrow keys.
2) Go to the Home tab, find the Merge & Center button in the Alignment group, and select from the options:
a) Merge & Center: Merges cells into one and centres the text.
b) Merge Across: Merges cells in each row without centring the text.
c) Merge Cells: Merges cells without centring the text.
d) Unmerge Cells: Reverses the merging.
Considerations:
a) Merging cells can cause data sorting and filtering issues.
b) If you select multiple cells, only the content of the upper-leftmost cell will be kept.
How to add Leading Zeros in Excel?
To put leading zeros in Excel, you can utilise custom number formatting, the TEXT function, or an apostrophe for text values. Here's how:
Custom Number Formatting:
1) Select the cells.
2) Right-click and choose Format Cells.
3) In the Number tab, select Custom and enter the format code, e.g., 00000.
Using the TEXT Function:
1) Use the formula =TEXT(A1, "00000") to add leading zeros to a number in cell A1.
Using an Apostrophe:
1) To treat a number with leading zeros as text, type an apostrophe before the number, e.g., '00123. ' Excel will recognise it as text.
Want to streamline your data in Excel? Head over to How to Split Cells in Excel and follow our easy guide to get started.
How to Create a Table in Excel?
To create a table in Excel, follow these steps:
1) Select Your Data: Choose the cells you want to include in your table.
2) Insert the Table: After selecting your data, click the Insert tab on the ribbon, then click the Table button in the Tables group. Ensure the "My table has headers" checkbox is checked, and remember to also insert a checkbox in Excel if needed for further customization.
3) Customise Your Table: Once the table is created, you can customize it using the Table Tools under the Design tab:
a) Change the Table Style
b) Add or Remove Columns/Rows
c) Add Total Row
How to Sort Your Data?
Sorting data in Excel is a fundamental task that allows users to organise information systematically. Here's how to effectively sort your data:
a) Choose the range of cells you want to sort
b) Go to the "Data" tab in Excel
c) Click on the "Sort" button.
d) Choose the column you want to sort by
e) Select whether you want to sort in ascending or descending order
How to Filter Your Data?
Mastering data filtering in Excel is essential for efficient data analysis and reporting. Let's explore how to filter your data:
a) Select the range of cells you want to filter
b) Go to the "Data" tab in Excel
c) Click on the "Filter" button
d) Use the drop-down arrows next to each column heading to filter the data based on specific criteria.
How to use Formulas in Excel?
Formulas in Excel help automate calculations, making tasks like HRA Calculation in Excel more efficient and accurate."
Entering a Formula:
Click on a cell and type = to start a formula.
Enter the formula, such as =A1+B1, and press Enter to see the result.
Using Built-In Functions:
Use functions like SUM for adding (=SUM(A1:A10)), AVERAGE for finding averages (=AVERAGE(B1:B10)), and IF for logical tests (=IF(C1>50, "Pass", "Fail")).
Copying Formulas:
Drag the fill handle (the small square at the cell's bottom right) to copy formulas across cells. Excel automatically adjusts cell references.
How to Make a Pivot Chart in Excel?
Want to secure your data? Learn How to Lock Cells in Excel with our easy-to-follow guide and keep your important information safe!
Step 1. Insert a pivot chart
1) Select Your Data: Highlight the range of data you want to use for your pivot chart.
2) Insert the Pivot Chart:
a) Go to Insert tab on the ribbon.
b) Click on PivotChart in the Charts group.
c) In the dialogue box, choose where you want the PivotChart to be placed (new or existing worksheet), then click OK.
Step 2. Configure pivot chart
Set Up the Pivot Chart:
a) After inserting the PivotChart, the PivotChart Fields pane will appear.
b) Drag and drop fields into the Filters, Columns, Rows, and Values areas to arrange your data.
Customise the Chart:
a) Use the Chart Tools on the ribbon to adjust the chart’s design, layout, and format.
b) You can add labels, change the chart type, and modify colours to suit your preferences.
Want to stand out in your next Excel interview? Check out these common Excel Interview Questions and practice your skills.
How to Create a Chart from a Pivot Table?
1) Select the Pivot Table:
Click anywhere within your pivot table to ensure it's selected.
2) Insert the Chart:
a) Go to the Insert tab on the ribbon.
b) In the Charts group, choose the chart type that best represents your data (e.g., Column Chart, Line Chart, Pie Chart).
c) Click on your preferred chart type, and Excel will generate a chart based on your pivot table data.
3) Customise the Chart:
Customise your chart using the Chart Tools. You can add titles, labels and change the chart type, and adjust the style to better suit your data presentation needs.
How to Print Your Work?
Printing your work in Excel is crucial in sharing or presenting your data. Here's a step-by-step guide on how to print your work in Excel:
a) Go to the "File" tab in Excel
b) Click on "Print"
c) Make adjustments to the print settings, like the number of copies, page orientation, and print quality.
d) Review the preview and make any necessary adjustments
e) Click "Print" to send your spreadsheet to the printer
Streamline your workflow with our Microsoft Excel VBA and Micro Training - book your spot now!
Conclusion
Excel is a widely used tool that has excellent features for managing and analyzing data. By mastering how to use Excel, you can uncover its full potential and effectively streamline your workflow. Nevertheless, exploring Excel Alternatives can also offer unique features for different data management needs. Additionally, learning how to include Excel skills on your resume can highlight your expertise and make you stand out in the job market. Whether you're a novice or an experienced user, this extensive blog can help you harness the power of Excel to accomplish your tasks with ease and efficiency.
Understand the use of payment functions in Microsoft Excel with our Excel For Accounting Course!
Frequently Asked Questions
What Careers Would use Excel?
Excel is frequently utilised in professions within finance, accounting, data analysis, project management, marketing, sales, human resources, and administration. Experts in these industries depend on it for budgeting, financial modelling, data visualisation, reporting, inventory management, and scheduling.
What are the Tips for Improving Productivity With Excel?
To improve productivity with Excel, use shortcuts for quick navigation, create templates for repetitive tasks, leverage formulas and functions for automation, utilise PivotTables for data analysis, and organise data with tables and conditional formatting respectively.
What are the Other Resources and Offers Provided by The Knowledge Academy?
The Knowledge Academy takes global learning to new heights, offering over 3,000 online courses across 490+ locations in 190+ countries. This expansive reach ensures accessibility and convenience for learners worldwide.
Alongside our diverse Online Course Catalogue, encompassing 19 major categories, we go the extra mile by providing a plethora of free educational Online Resources like News updates, Blogs, videos, webinars, and interview questions. Tailoring learning experiences further, professionals can maximise value with customisable Course Bundles of TKA.
What is The Knowledge Pass, and How Does it Work?
The Knowledge Academy’s Knowledge Pass, a prepaid voucher, adds another layer of flexibility, allowing course bookings over a 12-month period. Join us on a journey where education knows no bounds.
What are Related Courses and Blogs Provided by The Knowledge Academy?
The Knowledge Academy offers various Microsoft Excel Courses, including the Microsoft Excel VBA and Macro Training, Excel for Accounting Course, and Excel Training with Gantt Charts. These courses cater to different skill levels, providing comprehensive insights into creating Gantt Chart for Multiple Projects in Excel.
Our Office Applications Blogs cover a range of topics related to Microsoft Excel, offering valuable resources, best practices, and industry insights. Whether you are a beginner or looking to advance your Office Application skills, The Knowledge Academy's diverse courses and informative blogs have got you covered.
Upcoming Office Applications Resources Batches & Dates
Date
 Microsoft Excel Course
Microsoft Excel Course
Mon 9th Jun 2025
Microsoft Excel Course
Mon 8th Sep 2025
Microsoft Excel Course
Mon 1st Dec 2025
 If you wish to make any changes to your course, please


