We may not have the course you’re looking for. If you enquire or give us a call on +65 6929 8747 and speak to our training experts, we may still be able to help with your training requirements.
We ensure quality, budget-alignment, and timely delivery by our expert instructors.
- Quick Powerful Graphics with Power View, PowerPivot, Power Query, Power Map and Power BI M55164
- Microsoft Power BI for End Users 55400AC
- Retired : Designing and Implementing Enterprise-Scale Analytics Solutions Using Microsoft Azure and Microsoft Power BI DP500
- Microsoft Power BI Data Analyst PL300
- Microsoft BI Training

data plays a crucial role in decision-making, whether it's during a project pitch or a business meeting. However, complex data can be difficult to understand, which may negatively impact the outcome. Power BI Projects, with their powerful visualisation features, can help overcome this challenge by simplifying data and providing easy-to-grasp visual insights.
According to Statista, the Business Intelligence (BI) tools market is expected to grow to 12.18 billion GBP in the coming years. In this blog, we will uncover some practical Power BI Project ideas using sample datasets. Read on to explore the latest and most interesting Power BI Projects!
Table of Contents
1) Power BI Projects Ideas: Basic Level
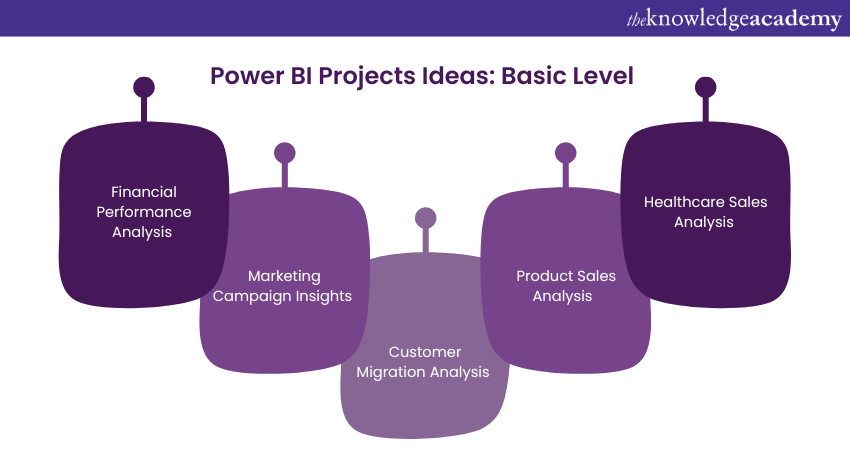
a) Financial Performance Analysis
b) Marketing Campaign Insights
c) Customer Migration Analysis
d) Product Sales Analysis
2) Power BI Projects Ideas: Intermediate Level
3) Power BI Projects Ideas: Advanced Level
4) Conclusion
Power BI Projects Ideas: Basic Level
Power BI is an invaluable tool for visualising data to facilitate informed business decisions. In this section, we will explain some basic Power BI project ideas for beginners to undertake with ease.

1) Financial Performance Analysis
People use Power BI Projects for analysing finances by measuring the Key Performance Indicators (KPIs), financial statements and charts. The collected parameters are then used for analysing finances. This type of project is useful for accounting companies as it can help fine-tune the client's financial reports. It increases the accuracy and efficiency of these reports.
This type of Power BI Project helps clients get a better understanding of their finances as well as their work efficiency. So, projects like this help transition away from conventional financial reporting tools like Excel.

2) Marketing Campaign Insights
Marketing campaigns are crucial for generating leads, attracting potential clients, and maintaining communication with existing customers. Analysing the campaign data provides insights into potential clients, marketing mediums, and overall costs. Utilising this data with Power BI helps optimise campaigns by evaluating their effectiveness, functionalities, and performance. This project can also be used to assess product features, marketing channel performance, and client interests.
Exploratory data analysis, statistical analysis, and visualisations can be performed in Power BI using a marketing analytics dataset. An interactive Power BI dashboard can be developed to display key insights on a single-page sheet, providing a comprehensive view of campaign success and tasks.
3) Customer Migration Analysis
Building a customer base requires significant time and effort, yet a single misstep can cause rapid loss. Companies often fear losing customers to competitors and face the ongoing challenge of customer attrition, where clients lose interest in their products. Understanding why customers disengage, identifying the influencing factors, and determining necessary mitigation steps is crucial. Power BI can be instrumental in this analysis.
In this Power BI Project, users, from business managers to regional sales managers, can explore the reasons behind declining sales and customer engagement. The project allows for deep analysis using visualisation techniques to highlight profit spreads, sales data, cash inflows, and specific product attrition rates by region.
4) Product Sales Analysis
Organisations rely on accurate sales documentation to gain insights into business performance and identify products for improvement. However, effective analysis and optimisation techniques are crucial, prioritising quality over quantity of data.
A project analysing sales data with Power BI enables companies to monitor sales effectively and visualise profit margins and other key sales factors. Leveraging Power BI's capabilities with Microsoft's sample dataset facilitates clear, actionable insights. Before visualisation, connecting the dataset to Power BI Desktop is essential to filter out irrelevant data.
5) Healthcare Sales Analysis
The healthcare sales analysis using Power BI focuses on providing insights into pharmaceutical sales, patient demographics, and treatment outcomes. The key objectives include optimising resource allocation, improving patient outcomes, and maximising profitability. Metrics such as sales volume by region, patient recovery rates, and market share are essential for comprehensive analysis.
An example dashboard might feature interactive charts showing sales trends, demographic breakdowns, and correlation panels that highlight relationships between treatment types and patient outcomes. The impact on healthcare decision-making is profound, as these insights enable better strategic planning and targeted marketing efforts.
Filter smarter with Power BI Slicer, customize reports and uncover key insights instantly.
Power BI Projects Ideas: Intermediate Level
Are you impressed with the capabilities of Power BI? If so, the above projects are just the beginning. In this section, you will explore intermediate-level Power BI Projects, which offer more complexity and a wide range of use cases.

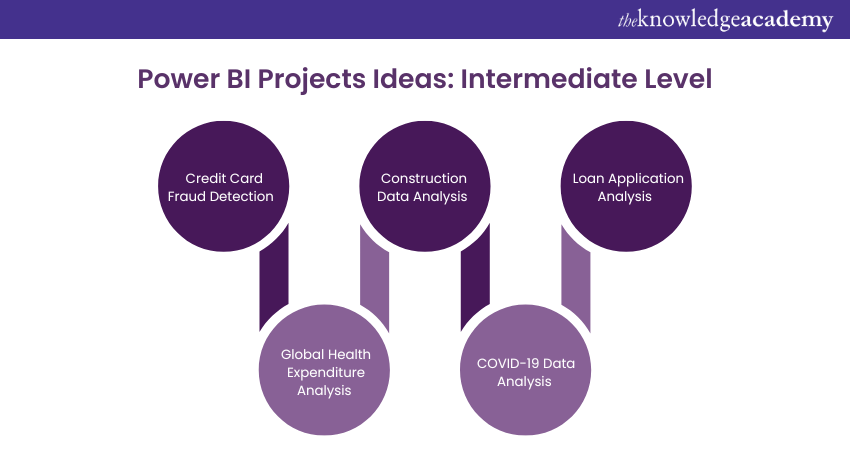
1) Credit Card Fraud Detection
To combat the surge in credit card fraud, a Power BI Project can be instrumental in detecting suspicious transactions. By leveraging Machine Learning (ML), abnormal events during credit card purchases can be easily identified.
Initially, the dataset must be imported into Power BI Desktop using a web connector. Subsequently, a pre-trained model or Power BI's functionalities can be employed to identify anomalies.
Upon detection, anomalies must be labelled for further analysis. This can be achieved through the Power Query Editor using a Python script, employing techniques like get_outliers(). Once labelled, these anomalies can be visualised on a dashboard using elements such as treemaps and line charts. This visualisation aids in comprehending and analysing the detected outliers.
2) Global Health Expenditure Analysis
Global health expenditure analysis leverages PyCaret and the K-Means algorithm to delve into health expenditure trends worldwide. This project uses the latest health expenditure dataset sourced from the World Health Organisation (WHO) database.
PyCaret, a versatile Machine Learning Library (MLL), is instrumental in conducting clustering analysis within Power BI. By employing PyCaret, data with common features can be effectively grouped, enabling the detection of fundamental data structures. The K-Means algorithm further enhances the analysis by efficiently training the clustering model. Once the dataset is uploaded into Power BI Desktop and the model is trained, the cluster items can be visualised on the dashboard, providing detailed insights into health expenditures.
3) Construction Data Analysis
Analysing construction data is vital for enhancing project efficiency, optimising resource use, and reducing expenses. A Power BI Project focusing on construction data analysis can yield profound insights into different facets of construction management. This project would involve gathering and visualising data such as material costs, labour efficiency, project timelines, and safety records.
The analysis can identify trends, forecast potential delays, and highlight areas for cost reduction, assisting Project Managers in making informed decisions, streamlining operations, and boosting overall project performance.
4) COVID-19 Data Analysis
COVID-19 has turned the world upside down, impacting millions and revealing the preparedness gaps in many countries. With Power BI, dive deep into the data, exploring active cases, recoveries, deaths, and mortality rates by country. This raw data might seem daunting, but it becomes accessible and insightful through a Power BI dashboard.
On this dashboard, dissect the data on individual pages and get a clear overview of the key performance indicators (KPIs) on the summary page.
5) Loan Application Analysis
The loan application analysis project aims to streamline the process of loan approval and identify potential default risks using Power BI. Critical data points for analysis include applicant credit scores, employment history, loan amount requested, and previous financial behaviour.
The project can leverage Power BI to create predictive visualisations that estimate loan approval rates and find patterns that may indicate a higher risk of default. For financial institutions, the benefits of such analysis are substantial, leading to more informed decision-making, reduced risk, and enhanced customer satisfaction by quicker processing times.
Gain an understanding of the database dimensional modelling with our Pentaho BI Training – join today!
Power BI Projects Ideas: Advanced Level
Power BI, a robust Business Intelligence (BI) tool, enhances decision-making through its advanced visualisation capabilities. In this section, we will explore some advanced-level Power BI Project ideas.

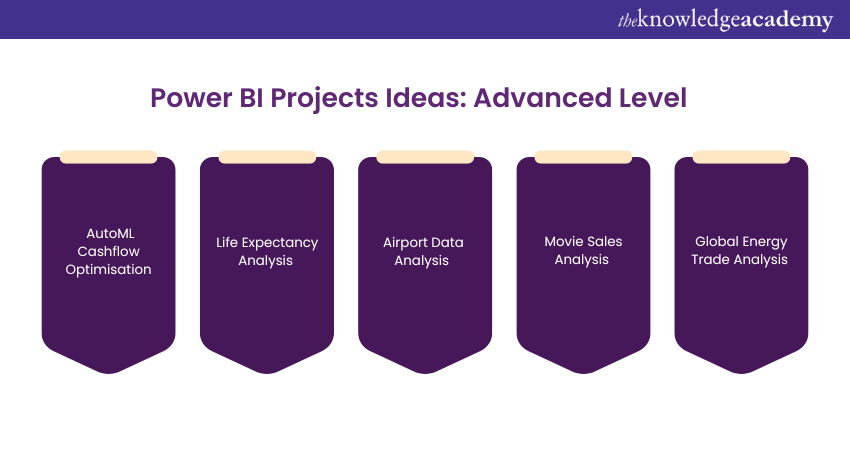
1) AutoML Cashflow Optimisation
Power BI combined with AutoML is used to forecast and optimise business cash flows. This project involves analysing historical financial data to predict future cash requirements, identify potential cash gaps, and suggest strategies to improve cash flow management. Insights from this analysis can guide financial planning and risk management, ensuring that businesses can sustain operations and invest in growth opportunities effectively.
2) Life Expectancy Analysis
Employ Power BI to explore various health indicators from global datasets to analyse life expectancy trends. This project can reveal how different factors such as diet, public health policies, healthcare access, and socioeconomic status influence life expectancy across regions. The results can be visualised to show disparities and progress over time, providing valuable information for enhancing health strategies and interventions. Data-driven decisions can thus significantly improve public health outcomes.
3) Airport Data Analysis
Leverage Power BI to analyse airport operation data, including flight volumes, passenger traffic, baggage handling times, and security operations. Assessing these metrics can identify bottlenecks in airport processes and suggest improvements to enhance efficiency and passenger experience. Additional insights might include peak operation times, leading to better staff allocation and resource management, thereby optimising operational flow and reducing passenger wait times.
4) Movie Sales Analysis
Utilise Power BI to dissect movie industry data, tracking box office sales against budgets, audience demographics, and critical reviews. This analysis can provide movie producers and distributors with insights into what factors most significantly impact a movie's financial success. These insights can help them make informed decisions about film production and marketing strategies. Further exploration could analyse seasonal trends and viewer preferences, enabling targeted marketing campaigns and strategic release schedules to maximise box office revenue.
5) Global Energy Trade Analysis
The global energy trade analysis aims to find patterns and trends in the international energy market using Power BI. It focuses on trade data like volumes, prices, and the geopolitical factors that influence them. The dashboard might include real-time price trackers, maps showing energy flow, and time series analysis of trade volume changes.
This analysis helps stakeholders understand the strategic implications of shifts in the global energy landscape, such as identifying emerging markets or potential risks associated with geopolitical changes. These insights are crucial for companies looking to optimise their operations and investment strategies in the energy sector.
Learn the concepts of logging and configuration with our Microsoft BI Training – join today!
Conclusion
We hope you found this blog informative and gained an understanding of the variety of Power BI Project ideas suitable for all skill levels, from beginner to advanced. As Power BI is a powerful tool with extensive applications, becoming proficient in its use can significantly improve your data analysis capabilities.
Learn to connect Power BI to various data sources with our Microsoft Power BI Training – join today!
Frequently Asked Questions
Which is Better, Power BI or Tableau?

Choosing between Power BI or Tableau depends on specific user needs and organisational contexts. Power BI is favoured for its integration with Microsoft products and cost-effectiveness, whereas Tableau excels in creating more advanced and intricate data visualisations.
Is Power BI the Same as Excel?

No, Power BI and Excel are not the same. While both are Microsoft products used for data analysis and visualisation, Power BI is specifically designed for business intelligence (BI) with advanced analytics and data sharing capabilities, whereas Excel is a versatile spreadsheet tool that handles a wide range of data manipulation tasks.
What are the Other Resources and Offers Provided by The Knowledge Academy?

The Knowledge Academy takes global learning to new heights, offering over 3,000 online courses across 490+ locations in 190+ countries. This expansive reach ensures accessibility and convenience for learners worldwide.
Alongside our diverse Online Course Catalogue, encompassing 19 major categories, we go the extra mile by providing a plethora of free educational Online Resources like News updates, Blogs, videos, webinars, and interview questions. Tailoring learning experiences further, professionals can maximise value with customisable Course Bundles of TKA.
What is the Knowledge Pass, and How Does it Work?

The Knowledge Academy’s Knowledge Pass, a prepaid voucher, adds another layer of flexibility, allowing course bookings over a 12-month period. Join us on a journey where education knows no bounds.
What are Related Courses and Blogs Provided by The Knowledge Academy?

The Knowledge Academy offers various including Business Intelligence Reporting Training, including Microsoft Power BI Course, Microsoft BI Training and Cognos BI Training. These courses cater to different skill levels, providing comprehensive insights into How to Create Date Hierarchy in Power BI?
Our Office Applications Blogs cover a range of topics related to Power BI, offering valuable resources, best practices, and industry insights. Whether you are a beginner or looking to advance your Power BI skills, The Knowledge Academy's diverse courses and informative blogs have got you covered.
Upcoming Microsoft Technical Resources Batches & Dates
Date
 Microsoft Power BI Course
Fri 28th Feb 2025
Fri 4th Apr 2025
Fri 16th May 2025
Fri 11th Jul 2025
Fri 19th Sep 2025
Fri 21st Nov 2025


 Top Rated Course


 If you wish to make any changes to your course, please


