We may not have the course you’re looking for. If you enquire or give us a call on 800969236 and speak to our training experts, we may still be able to help with your training requirements.
Training Outcomes Within Your Budget!
We ensure quality, budget-alignment, and timely delivery by our expert instructors.

Understanding Statistical methods can feel like stepping into a maze of numbers and equations. But fear not! In this confusing domain, there's one method called Multiple Regression Analysis (MRA) that can help you make sense of it all. But do you know What is Multiple regression Analysis?
Suppose you've got multiple variables lying around in front of your eyes, and you're trying to figure out the secret connections between them. That's where Multiple Regression Analysis swoops in. It's a powerful torch that cuts through the statistical darkness, revealing the hidden relationships shaping real-world happenings.
Thus, it is crucial to learn about this Statistical method, particularly if you are new to the Data Science domain. So, read this blog to learn What is Multiple Regression Analysis. Also, explore the formula used and how to calculate it. Let's delve in!
Table of Contents
1) Understanding What is Multiple Regression Analysis
2) Multiple Regression Analysis formula
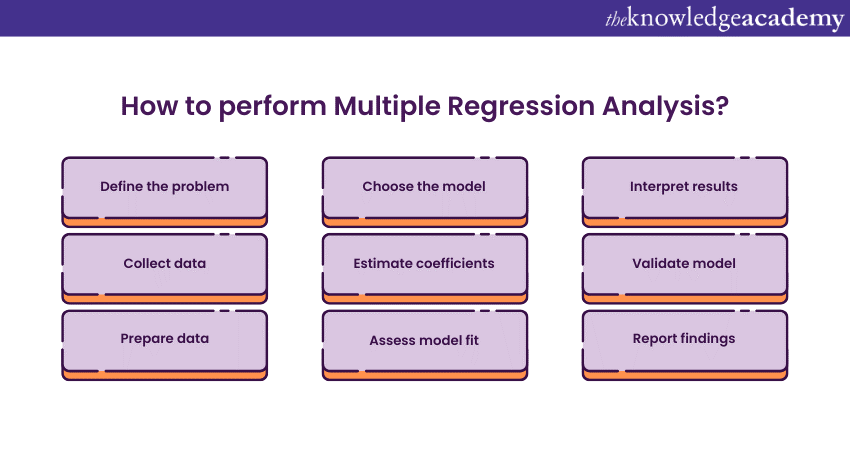
3) How to perform Multiple Regression Analysis?
4) When can you use Multiple Regression Analysis?
5) Conclusion
Understanding What is Multiple Regression Analysis
Multiple Regression Analysis is a Statistical method used to examine the relationship between one dependent variable and two or more independent variables. Its primary purpose is to predict the dependent variable's value based on the independents' values. This Analysis helps in understanding how various factors collectively influence a particular outcome.
It's widely used in economics, social sciences, and business for forecasting and decision-making. By analysing data through this method, researchers can isolate the effect of each independent variable, controlling for others and providing valuable insights into complex interdependencies and causal relationships.
Multiple Regression Analysis formula
The formula for Multiple Regression Analysis is typically represented by the following equation:
Where,
a) Y is the dependent variable you are trying to predict or explain.
b) These are the independent variables that are used to predict Y.
c) is the y-intercept (constant form).
d) are the coefficients for the independent variables which represent the change in.
e) Y for a one-unit change in the corresponding X variable.
f) ε represents the error term, accounting for the variability in Y not explained by the independent variables.
How to perform Multiple Regression Analysis?
After learning What is Multiple Regression Analysis and its formula, it is time to understand how it can be calculated. These are the following steps that you can follow to perform Multiple Regression Analysis:

1) Identify all predictor variables
To perform Multiple Regression Analysis, the first step is to identify all predictor variables, which are the independent variables used in the Analysis. These are the factors that may influence the dependent variable. The selection of predictor variables should be based on theoretical understanding, previous research, or exploratory analysis.
Choosing relevant variables and having a logical connection to the dependent variable is crucial. Including irrelevant predictors can reduce the model's accuracy, while omitting important ones can lead to a biased or incomplete understanding of the dependent variable's behaviour.
2) Determine the regression coefficient at the initial time
Determining the regression coefficients at the initial time in Multiple Regression Analysis involves estimating the coefficients (βs) values that best fit the data at the beginning of the study or observation period. These coefficients represent the strength and direction of the relationship between each independent and dependent variable.
Initially, these coefficients are calculated using statistical techniques like Ordinary Least Squares (OLS), which aim to minimise the difference between the observed values and the values predicted by the model. This initial estimation provides a baseline to analyse how variables influence the outcome over time.
3) Recognise the regression coefficients for the b variables
Recognising the regression coefficients for the 'b' variables in Multiple Regression Analysis involves understanding their meaning and significance. These coefficients are typically denoted as representing each independent variable's individual impact on the dependent variable.
A coefficient indicates how much the dependent variable is expected to change when that independent variable increases by one unit, assuming all other variables remain constant. It's crucial to assess these coefficients for statistical significance and practical relevance to determine if and how each predictor influences the outcome. This helps guide informed decisions and interpretations of the model.
4) Aggregate these values
In Multiple Regression Analysis, aggregating these values typically refers to combining the calculated regression coefficients for each independent variable into a single predictive model. This involves taking the individual coefficients (the 'b' values) determined for each variable and integrating them into the regression equation.
The resulting equation represents the independent variables' collective influence on the dependent variable. Aggregating these values allows for a comprehensive understanding of how changes in the predictor variables collectively impact the outcome variable. Therefore, it provides a more holistic view of the data being analysed.
5) Assess the results
Assessing the results in Multiple Regression Analysis involves evaluating the model's statistical significance and practical implications. This step includes examining the regression coefficients to understand each predictor's impact, assessing the model's overall fit through measures like R-squared, and conducting hypothesis tests.
It's essential to check for assumptions like linearity, independence, and homoscedasticity (a presumption of equal or similar variances in different groups when compared). Analysts also need to be aware of potential issues like multicollinearity. The assessment concludes with interpreting the findings in the context of the research question, determining the model's validity and reliability, and considering its implications for theory or practice.
Learn Accounting in detail with our Accounting Masterclass - sign up now!
When can you use Multiple Regression Analysis?
Now that you know What is Multiple Regression Analysis, let’s understand its uses. It is a versatile statistical technique applicable in various contexts where understanding the relationship between a dependent variable and multiple independent variables is crucial. Here are some scenarios where Multiple Regression Analysis is particularly useful:
a) Predicting outcomes: In fields like finance or economics, MRA is used to forecast future trends, such as predicting stock prices or economic growth, based on multiple influencing factors like interest rates, inflation, or market demand.
b) Business decision-making: Companies use MRA to understand how different factors affect sales, customer behaviour, or product demand. For example, a business might analyse how pricing, advertising spending, and market trends collectively influence sales.
c) Healthcare research: In medical research, MRA helps understand how various factors (like age, lifestyle, and genetic predispositions) collectively impact health outcomes. It's used in epidemiology to study the multifactorial nature of diseases.
d) Social sciences: Researchers in psychology, sociology, and education often use MRA to study the impact of various social, economic, and psychological factors on human behaviour or societal trends.
e) Engineering and physical sciences: In these fields, MRA aids in modelling complex phenomena where multiple variables interact, like in climate modelling or material strength analysis under varying conditions.
f) Quality control and improvement: In manufacturing, MRA is used to understand how different production variables affect the quality of the final product, aiding in process optimisation.
g) Real estate and urban planning: It helps in assessing property values based on various factors like location, size, amenities, and market trends. It also aids urban planners in understanding the impact of different variables on urban development.
h) Marketing analysis: In marketing, it is used to assess the impact of various advertising channels, customer demographics, and market conditions on product popularity and brand perception.
i) Policy making and evaluation: Governments and NGOs use MRA to understand the effectiveness of policy interventions across different sectors, considering various socio-economic variables.
j) Sports science: Sports analytics helps evaluate how training, nutrition, and psychological preparation impact athletes' performance.
k) Environmental studies: It is used to assess the impact of various environmental factors on ecological systems, pollution levels, or climate change.
Are you interested in learning how to perform Regression Analysis Training? Sign up now!
Conclusion
Understanding What is Multiple Aggression Analysis helps you predict the relationship between one dependent variable and several independent variables. Its widespread application across various fields, from economics to healthcare, highlights its versatility in analysing complex, multifaceted data sets, aiding in informed decision-making.
Do you want to learn how to perform forecast training? Register now for our Financial Modelling and Forecasting Training!
Frequently Asked Questions
Upcoming Accounting and Finance Resources Batches & Dates
Date
 Regression Analysis Training
Fri 7th Mar 2025
Fri 2nd May 2025
Fri 4th Jul 2025
Fri 5th Sep 2025
Fri 7th Nov 2025


 Top Rated Course


 If you wish to make any changes to your course, please


