


 Top Rated Course


We may not have the course you’re looking for. If you enquire or give us a call on + 1-866 272 8822 and speak to our training experts, we may still be able to help with your training requirements.
Grafana vs Kibana: The Ultimate Dashboard Comparison
Sienna Roberts 12 December 2024Wondering about the differences between Grafana vs Kibana? Both are powerful Data Visualisation tools, but they serve distinct purposes. Grafana excels in time-series Data Analytics, while Kibana is ideal for log analysis with Elasticsearch. In this blog, we'll break down their features, use cases, and performance.

Training Outcomes Within Your Budget!
We ensure quality, budget-alignment, and timely delivery by our expert instructors.
Table of Contents
In the dynamic landscape of data visualisation and monitoring, Grafana and Kibana stand out as two powerful platforms, each offering unique features and functionalities. Whether you are managing logs, exploring metrics, or visualising data, choosing between Grafana vs Kibana requires a nuanced understanding of their capabilities.
According to MarketsandMarkets, the market size for Business Intelligence software is expected to reach GBP 26.20 billion by 2025. Witch such a large revenue pool, it is only natural for young professionals to aspire to become a part of this industry. This comprehensive blog explores various aspects of Grafana vs Kibana, helping you make an informed decision based on your specific needs.
Table of Contents
1) What is Grafana?
2) Benefits of Grafana
3) What is Kabana?
4) Benefits of Kibana
5) Differences between Grafana and Kibana
6) Data Source Integration: Grafana
7) UI and UX Design: Kibana
8) Documentation and Support: Grafana
9) Conclusion
What is Grafana?
Grafana is an open-source analytics and monitoring platform that integrates with various data sources, providing a unified interface for visualising metrics, logs, and other data. It supports diverse data repositories, including databases, cloud services, and custom APIs.
Grafana is an open-source analytics and monitoring platform that integrates with various data sources, providing a unified interface for visualising metrics, logs, and other data. It supports diverse data repositories, including databases, cloud services, and custom APIs. Grafana enables users to create interactive and customisable dashboards, facilitating real-time monitoring and analysis. With a user-friendly interface and a rich ecosystem of plugins, Grafana has become a popular choice for DevOps teams, enabling them to gain insights into system performance, troubleshoot issues, and make data-driven decisions. Its flexibility and extensibility make it valuable across industries for visualising and understanding complex datasets.

Benefits of Grafana
Therefore, the following are the benefits that come with Grafana that make it the go-to tool for data visualisation and monitoring. Some benefits include; flexibility, swift, and strong connections that assist the company to have proper decisions and proper organisational effectiveness.
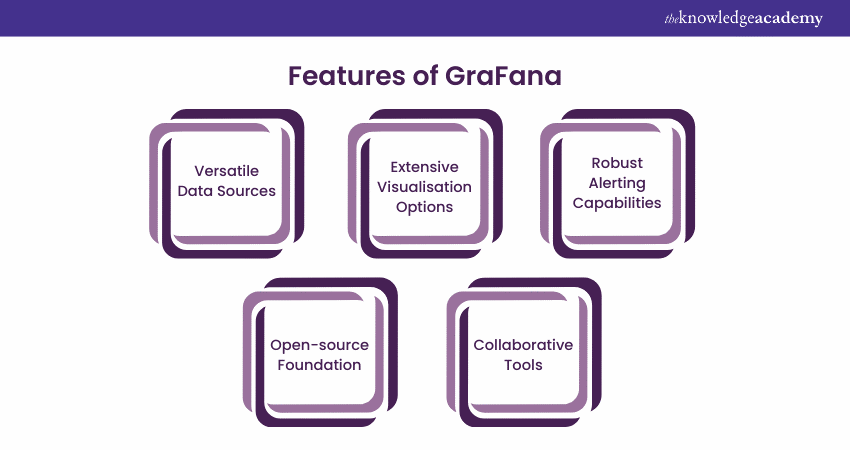
Here are some key benefits of Grafana:
a) Wide Data Source Integration: Integrates itself with other data such as Elasticsearch, Prometheus, and InfluxDB enable it to work smoothly.
b) Customisable Dashboards: Enables nice back-end customisation where users can develop specific dashboards for various usage or areas of departments.
c) Alerting and Notifications: Integrated alarm system that can be used to notify clients for any deficiencies in real time mode.
d) Open Source and Cost-effective: Web: It is an open source xampp the wordpress is free with a large community offering assistance and plug-ins.
e) User-friendly Interface: Hatchability for easy usage by non-technical individuals and simple interface of developing and using the dashboards.
f) Highly Scalable: Designed for high throughput operations in various configurations.
g) Advanced Visualisation Options: Like charts, graphs and gauges to have more information on the results.
h) Flexible Alerting: Apply premium scanning filters and receive alerts through different mediums (mail, slack, etc.)
The given number of features makes Grafana convenient for multiple purposes presupposing monitoring, Data Analysis and decision-making under real-time conditions.
Transform your data into actionable insights with our Grafana Training - Sign up today!
What is Kibana?
Kibana is an open-source Data Visualisation and exploration tool for Elasticsearch. It is the front-end interface for interacting with Elasticsearch, enabling users to visualise and analyse their data effectively.
Developed by Elastic, Kibana allows users to create interactive dashboards, charts, and graphs to explore and understand large datasets. It supports real-time data analysis, making monitoring and log analytics valuable. With its user-friendly interface and powerful features, Kibana is widely used for data visualisation and exploration in conjunction with Elasticsearch, forming a comprehensive solution for searching, analysing, and visualising diverse datasets.
Benefits of Kibana
Kibana being a visual exploration tool of data supports integration with Elasticsearch through which users can get a real view and start the process of Data Analysis. It assists organisations get insights from large volumes of information through clickable representations and refined inquiry tools.
Key Benefits of Kibana:
a) Real-time Data Visualisation: Kibana is a tool that makes it possible for users to work with the data in real-time and to be able to see any changes which are taking place within the business in real-time.
b) Seamless Integration with Elasticsearch: Completely compatible with elasticsearch, allowing data mining based on elasticsearch’s powerful search tools extended for advanced analytics.
c) Customisable Dashboards: Users can build and design their own dashboards depending on their likes enabling them to engage in data analysis easily.
d) Advanced Querying and Filtering: Through several querying layers the user can select specific facets and make complex queries that allow to locate desired targets in vast Kibana databases more effectively.
e) Data Exploration with Discover: The Discover feature describes raw data allowing the user to focus on selected data and make further assessments.
f) Visualisation Variety: Kibana provides a multitude of uses for displaying data, including bar charts, line graphs, pie graphs, maps and additional, to make data more consumable.
g) Security Features: When Elastic Stack’s security tools are implemented, Kibana guarantees that the data is secure as it is made available to the right users.
Differences Between Grafana and Kibana
The following are the key differences between Grafana and Kibana:
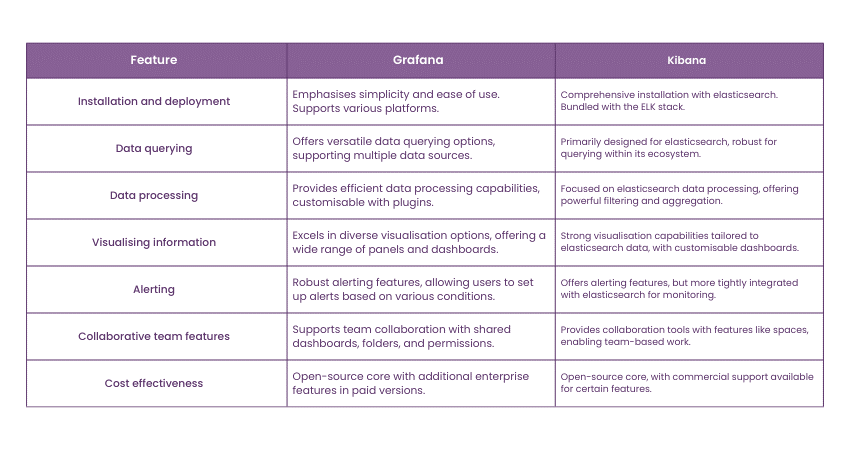
1) Installation and Deployment
First of all, Grafana is a very friendly and easy to install lightweight tool. CNC users are able to download and run an executable file which makes it ideal for anyone in a hurry to set up the software. This feature facilitates deployment in different operating systems (OS) with less configuration.
Meanwhile, installation of Kibana can be more complex especially when part of Elastic Stack. In self-managing the cluster some indexing components such as Elasticsearch may need to be installed.
This process may be a little longer than Grafana and requires API specification and definition. But it offers a suitable and convenient solution for Data Visualisation and analysis at each step.
Consolidate and visualise your data in a unified manner by signing up for our Grafana Training now!
2) Data Querying
While Grafana offers a different approach to querying data compared to Kibana, it excels in working with multiple data sources, such as Elasticsearch, Prometheus, InfluxDB, and others. Grafana is unbeaten and has a very simple and intuitive query editor that is easy to use with no need to know any query languages.
Kibana, which is deeply embedded with Elasticsearch, can take advantage of the rich Query DSL, and provides more sophisticated query functions for users with Elasticsearch exposure. One of Kibana is Discover that includes features for interaction with data using tools for filtering and aggregation.
Despite the flexibility of Grafana, Kibana is better suited for organisations focused on Elasticsearch because of the tool’s integration and more powerful queries of data.
Dive into the world of reporting with our Business Objects Reporting - Sign up now!
3) Data Processing
There are two major differences in the way Grafana and Kibana work with data: First, it must be pointed out that Grafana is oriented on Data Visualisation and monitoring while utilising integrated data sources and processing tools. As such, it provides fresh views and monitors data rather than processing the same through these integrations.
Kibana when used together with Elasticsearch provides complex query and transformations, and aggregation functions. It is built on top of Elasticsearch search and analysis features to go beyond the basic data manipulation and offer a way to extract insights directly within the platform.
4) Visualising Information
Grafana provides all the different types of visualisations including charts, graphs, heat maps, by providing flexibility and ease of usage. The wide range of plugins let users modify the way it works in response to the data they are using and the type of visualisation they require.
Kibana, combined with Elasticsearch, aims at taking advantage of its outstanding analytical functions to make such visualisations as line charts, pie charts, as well as geo maps. This means that with the help of tools such as the Canvas and Lens editor, it is perfect for users who work in environments related to the Elastic Stack.
5) Alerting
Another interesting element that was added to Grafana is very intuitive Alerting, which is built into the Dashboard. Users can set up alerts connected to results of queries from different datasources, define conditions, thresholds, and notifications in channels like email, Slack, and PagerDuty to immediately solve existing problems.
On the other hand, Kibana has Watcher for alerting and notification built into Elasticsearch as a service. It is designed for customisable alerting using simple text that allows for defining conditions and corresponding actions with reference to the change in the Elasticsearch data. It also provides a solid ground for the ELK Stack data monitoring based on change recognition possibility.
6) Collaborative Team Features
Grafana has the feature of sharing dashboards and folders, it enables teams to build, to collaborate, and to work on visualisations. This feature improves efficiency as it allows present and future workflows to be done through a single source where multiple teams can track and respond to pertinent data discoveries.
Kibana provides collaboration by means of Spaces: it is possible to group dashboards and visualisations by teams or projects. This structured approach creates a better environment for team members to work in as it means that team members do not overlap on certain projects and initiatives.
7) Cost-effectiveness
One of the factors that can distinguish between Grafana and Kibana is price: they use different models of prices. Grafana is an open-source system, most of the essential features of which are provided free of charge, which is a considerable advantage for organisations that are limited in terms of finances.
At the same time Kibana also shares the theme of open source but is a part of the Elastic Stack and it has a commercial license that provides extra amenities, security and official support. These enhancements, however, can be useful to organisations that need them or can afford an Elastic subscription for additional capability in exchange for cost.
Data Source Integration: Grafana
Therefore, Grafana stands out with the feature set that mainly targets data visualisation across many platforms and sources. It supports numerous databases, cloud services, and monitoring systems, which let the user collect data into the single comfortable interface for real-time analysis.
For such reasons, Grafana has become popular with organisations that want to consolidate and display data from various systems in a single interface. This of course means that even technical professionals can make complex queries out of the Query Editor.
Key data sources supported by Grafana are:
a) Elasticsearch: For full-text search and analytics.
b) Prometheus: For time-series monitoring and alerting.
c) MySQL & PostgreSQL: For SQL-based database queries.
d) InfluxDB: For time-series data collection.
e) CloudWatch: For monitoring AWS resources.
UI and UX Design: Kibana
Kibana is a simple and easy to use tool created primarily to be used with the Elasticsearch engine. One such feature is Discover, others are Visualise and Dashboard wherein the users of different technical competency can analyse the data, modify and visualise it easily without finding their way round the site complicated.
Key UI and UX features in Kibana:
a) Discover: A data exploration feature that allows users to filter, query, and visualise data in real-time.
b) Visualise: Enables users to create and customise a range of visualisation types like bar charts, pie charts, and line graphs.
c) Dashboard: Offers a central location for users to bring together multiple visualisations into a cohesive, interactive view.
d) Canvas: A unique tool for designing pixel-perfect, dynamic presentations that combine data with rich visuals.
e) Lens: A simplified interface for creating visualisations quickly, enhancing the user experience by reducing complexity.
Documentation and Support: Grafana
Grafana has abundant materials and instructions to help users find their way and manage or enhance their utilisation of the application. The rich documentation suite comprises users’ manuals and API documentation irrespective of the users’ experience level.
Further, Grafana is an active project with a community that can be reached and professional support as necessary.
Key Features of Documentation and Support:
a) Comprehensive Documentation: Guidance and explanations of how different features work, how settings should be set, and lists of REST APIs for all types of users.
b) User Instructions and Tutorials: Guides that teach even inexperienced users how to easily set up and navigate the system to optimally use all the tools that Grafana offers.
c) Active Community Forum: An active forum in which the users can pose questions and get answers from other users as well as learn from them and get problems solved.
d) Professional Support: Professional support and consultancy and custom-tailored offering by Grafana Labs as an enterprise-grade SaaS vendor.
Conclusion
In the Grafana vs Kibana debate, the choice depends on specific use cases, preferences, and organisational requirements. Grafana excels in diverse data visualisation, offering flexibility and ease of use. On the other hand, Kibana, tightly integrated with Elasticsearch, stands out for log and event data analysis within the Elastic Stack ecosystem.
Unlock data insights with our Expert Business Intelligence Reporting – Register today!
Frequently Asked Questions
Is Grafana an Elasticsearch?

Grafana is not Elasticsearch, no. Grafana is a visualisation and data monitoring service that works with Elasticsearch to display data in the form of dashboards and graphs. Elasticsearch is the data storage and search engine for indices while Grafana beautifies and fosters Data Analysis and visualisation.
Are Kibana and Kafka the Same?
Kibana and Kafka are fundamentally different. Kibana is a data visualisation front-end that works with Elasticsearch to visualise data and explore log dashboards. In contrast, Kafka is a distributed event stream processing system designed for building real-time streaming data pipelines capable of handling unlimited throughput.
What are the Other Resources and Offers Provided by The Knowledge Academy?
The Knowledge Academy takes global learning to new heights, offering over 30,000 online courses across 490+ locations in 220 countries. This expansive reach ensures accessibility and convenience for learners worldwide.
Alongside our diverse Online Course Catalogue, encompassing 19 major categories, we go the extra mile by providing a plethora of free educational Online Resources like News updates, Blogs, videos, webinars, and interview questions. Tailoring learning experiences further, professionals can maximise value with customisable Course Bundles of TKA.
What is The Knowledge Pass, and How Does it Work?
The Knowledge Academy’s Knowledge Pass, a prepaid voucher, adds another layer of flexibility, allowing course bookings over a 12-month period. Join us on a journey where education knows no bounds.
What are the Related Courses and Blogs Provided by The Knowledge Academy?
The Knowledge Academy offers various Business Intelligence Reporting, including the Grafana Training, Microsoft Power BI Course and the Business Objects Reporting. These courses cater to different skill levels, providing comprehensive insights into Business Intelligence Developer.
Our Office Application Blogs cover a range of topics related to Grafana and Power BI, offering valuable resources, best practices, and industry insights. Whether you are a beginner or looking to advance your Business Tools and Management skills, The Knowledge Academy's diverse courses and informative blogs have got you covered.
 If you wish to make any changes to your course, please


