We may not have the course you’re looking for. If you enquire or give us a call on +44 1344 203999 and speak to our training experts, we may still be able to help with your training requirements.
We ensure quality, budget-alignment, and timely delivery by our expert instructors.

The Power BI software is a powerful Business Intelligence (BI) tool that empowers Business Analysts and other people to transform raw data into meaningful insights and interactive visualisations. Power BI Filters are one of the key features that make BI software a versatile and efficient Data Analysis tool. These features allow you to refine and narrow down data views, allowing for focused analysis and deeper exploration of key metrics and trends.
According to IBISWorld, the market size of Business Intelligence (BI) tools alongside the analytical software market reached around £884.9m in 2024. Such a rise in the popularity of BI tools is bound to lead to an increased demand for people capable of using BI tools to their fullest capacity. As powerful features, Power BI Filters allow you to analyse and visualise data differently. Keep reading this blog further to learn how to use Filters in Power BI!
Table of Contents
1) What is a Power BI Filter?
2) Business Benefits of Using Power BI
3) Different Types of Filters in Power BI
4) How to Apply Basic Filters in Power BI?
5) What is Cross-filtering?
6) Modes of Filters: Basic and Advanced
7) Power BI Slicer vs Filter
8) Comparison of Filter Types
9) Conclusion
What is a Power BI Filter?
A Power BI Filter is a powerful feature that allows you to refine and narrow down data views within your BI Reports and visualisations. These filters play a fundamental role in Data Analysis by allowing you to focus on specific subsets of data or segments of interest, helping you extract meaningful insights.
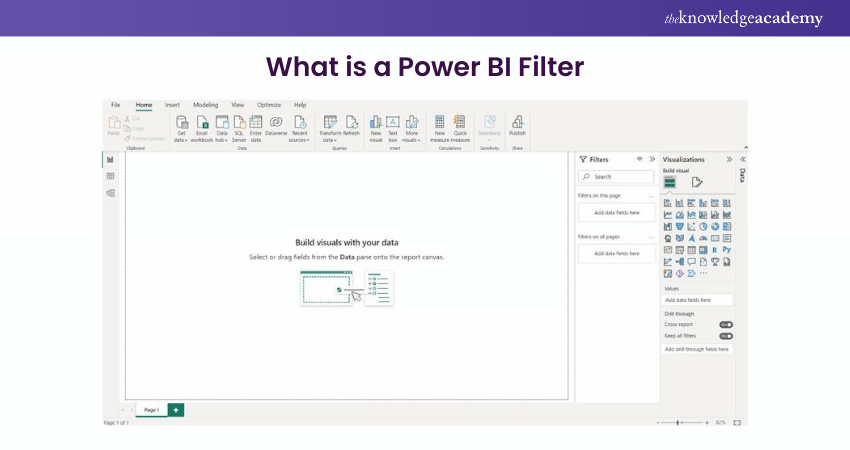
A Power BI Filter is a critical component that allows you to refine and narrow down data views within your BI reports and visualisations. It helps you focus on specific subsets of data or segments of interest, enabling you to extract meaningful insights from your data.
At its core, a Power BI Filter acts as a criterion or condition that restricts the data displayed based on predefined rules. By applying Filters, you can control which data is included or excluded from your visualisations, allowing for more targeted analysis and a deeper understanding of your data.
The general use of Power BI Filters involves specifying criteria to include or exclude data based on different dimensions or measures. You can use this tool to Filter data based on specific categories, values, date ranges, or numeric conditions. This flexibility lets you analyse data from various perspectives and answer specific business questions.
Applying Power BI Filters allows you to customise your data views, drill down into specific details, and gain insights relevant to your analysis goals. Filters provide an interactive and dynamic experience by letting users explore data from different angles and perspectives.
Whether analysing sales data, monitoring key performance indicators (KPI's), or exploring trends over time, Power BI Filters empower you to focus on the most relevant data and extract valuable insights. They enable you to ask and answer specific questions, support data-driven decision-making, and effectively communicate your findings to others.

Business Benefits of Using Power BI
Power BI is beneficial to businesses in multiple ways. Let's go through some of those advantages in the following points:
a) User-friendly Interface: A straightforward interface with drag-and-drop functionality for effortless Data Visualisation creation is a key advantage. Microsoft Power BI is designed to empower users across all organisational levels to make informed decisions with real-time analytics.
b) Diverse Data Sources: Power BI facilitates the importation of data from various sources, supporting both structured and unstructured data.
c) Cutting-edge AI: Leveraging Microsoft's robust AI capabilities, Power BI users can swiftly prepare data, construct Machine Learning (ML) models, and glean insights from diverse data types.
d) Seamless Excel Integration: Power BI seamlessly integrates with Excel, allowing users to collect, analyse, publish, and share Excel business data. Those familiar with Office 365 can effortlessly connect Excel queries, data models, and reports to Power BI Dashboards.
e) Live Stream Analytics: Power BI provides real-time data insights for dynamic visualisations, ensuring teams stay current and are equipped to make timely decisions.
f) Transforming Insights Into Action: Through Microsoft Power Platform, teams can swiftly act by integrating Power BI with Power Apps and Power Automate. This seamless integration facilitates the rapid development of business applications and the automation of workflows.
Different Types of Filters in Power BI
Power BI offers various Filters for different data scenarios and analysis needs. These include basic, advanced time intelligence and top N Filters. Here's a comprehensive list:
Basic Filters
Basic Filters are the foundation of the BI Filtering feature and include categorical and numerical options. They can be classified into two sub-categories:
a) Categorical Filter: A categorical Filter allows you to include or exclude specific categories or values in your data. For example, you can choose a sales dataset to display data only for a particular product category, such as "electronics" or "clothing". This option helps you focus on specific subsets of data based on categorical attributes.
b) Numerical Filter: A numerical Filter lets you select data based on numeric ranges or conditions. For instance, you can clarify an inventory dataset to show only products with prices greater than £50 or choose customer data to display those with ages between 25 and 40. It provides flexibility in analysing data based on numerical attributes.
s
Develop the necessary skills for Data Analysis with Business Intelligence Reporting Training today!
Advanced Filters
Advanced Filters provide more advanced capabilities for filtering data within specific visuals, pages, or even the entire report. It offers flexibility and customisation options beyond basic categorical and numerical Power BI Filters.
a) Visual-level filter: A Visual-level option allows you to apply filters to specific visuals within a report. For example, suppose you have a bar chart representing sales by region. In that case, you can apply this option to display data only for a particular region, such as "North America". This option helps you focus on specific data within a particular visualisation.
b) Page-level Filter: A Page-level option applies at the page level, impacting all visuals on a specific page. For instance, you can apply a Page-level Filter to show data for a specific time, such as "Q2 2022". This option helps you ensure consistency in data displayed across multiple visuals on a single page.
c) Report-level Filter: A Report-level option applies Filters consistently across all pages and visuals within a report. It allows you to separate data at a broader scope, such as filtering to display data for a specific product line, like "Electronics". This option ensures uniformity and coherence in Data Analysis throughout the entire report.
Time Intelligence Filters
Time intelligence filters are specifically designed to analyse time-based data. These Power BI Filters provide functions and calculations that enable you to compare data across different time periods, such as year-to-date, quarter-to-date, or rolling averages. It helps you uncover trends, patterns, and seasonality in your data.
a) Year-to Date Filter: A year-to-date option enables you to analyse data specifically for the current year, disregarding data from previous years. This option is particularly useful for tracking performance or comparing year-over-year metrics within a given time frame.
b) Rolling Average Filter: A rolling average option allows you to calculate and visualise the average of a measure over a rolling time window. For example, you can apply a 7-day Rolling Average Filter to smooth out fluctuations and analyse trends in daily sales data.
Top N Filters
a) Top N Filter: A Top N Filter allows you to focus on the top values within a specific measure. For instance, you can apply a Top 10 filter to display the Top 10 highest-selling products based on sales revenue. This option helps identify the dataset's most significant or influential data points.
b) Bottom N Filter: A Bottom N Filter is the counterpart of the top N option. It allows you to focus on the bottom values within a measure. For example, you can apply a Bottom 5 Filter to identify the five products with the lowest sales volume. This option helps identify outliers or underperforming data points.
5) Relative Data Filters
Relative Data Filters are time-series Data Filters that allow you to Filter data for past ‘N’ days, weeks even months. It is one of the most effective Data Filters.
6) Slicer
Slicer may not be considered a traditional Filter; however, its canvas visuals allow you to Filter page visuals. The interactive design offers a report with greater control over the data.
Learn Data Visualisation in Power BI with Microsoft Power BI Course!
How to Apply Basic Filters in Power BI?
Applying Filters in the Power BI software is a straightforward process that allows you to refine and narrow down your data view. Here are the detailed steps to apply different Power BI Filters.
By implementing certain Filters, you can efficiently refine your datasets and extract meaningful insights. Here are the detailed steps to apply basic Filters in the Power BI software.

The steps to apply the categorical Filter are as follows:
1) Identify the visual or dataset where you want to apply the Power BI Filter.
2) Locate the "Filters" pane in the BI tool.
3) Select the visual or dataset to activate it.
4) In the "Filters" pane, choose the categorical field you want to filter, such as "Product Category."
5) Select the specific category values you want to include or exclude from the data view.
6) BI will dynamically update the data view, showing only the data that matches the selected category values.
The steps to apply the numerical Filter are as follows:
1) Identify the visual or dataset where you want to apply the Power BI Filter.
2) Locate the "Filters" pane in the BI tool.
3) Select the visual or dataset to activate it.
4) In the "Filters" pane, choose the numerical field you want to filter, such as "Sales Amount."
5) Specify the numeric range or conditions for the filter, such as greater than £100.
6) BI will dynamically update the data view, showing only the data that meets the specified numerical criteria.
Try our Microsoft Power BI Certification Training and create powerful reports!
Applying Advanced Filters
Here are the detailed steps to apply advanced Filters in the Power BI software. Let’s explore each of them in detail:
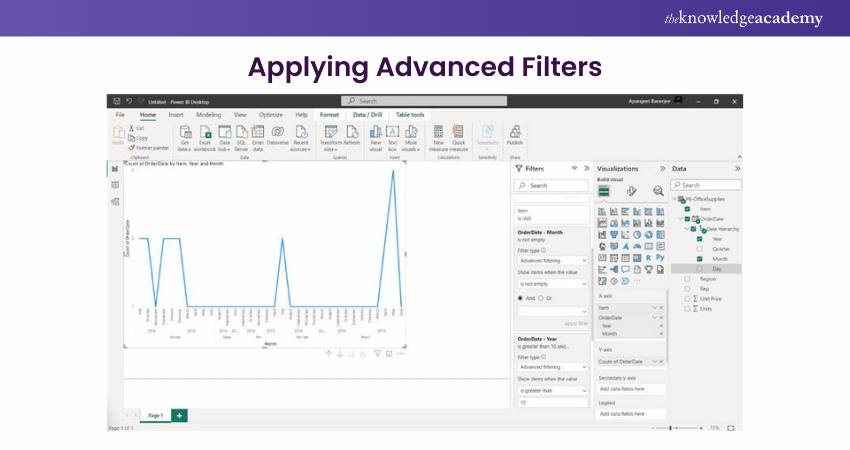
The steps to apply the Visual-Level Filter are as follows:
1) Identify the specific visual where you want to apply the Power BI Filter.
2) Within the visual, look for the filter icon or filter-related options.
3) Click on the Filter icon or access the Filter options.
4) Specify the filter criteria for the visual, such as selecting a specific region.
5) The visual will dynamically update, displaying data that matches the applied filter criteria.
The steps to apply the Page-Level Filter are as follows:
1) Identify the page in your report where you want to apply the Power BI Filter.
2) Locate the "Filters" pane in Power BI.
3) Select the entire page by clicking on a blank area within the page.
4) In the "Filters" pane, choose the desired fields and specify the filter criteria for each field.
5) Power BI will update all visuals on the page, showing data that matches the applied Filter criteria.
The steps to apply the Report-Level Filter are as follows:
1) Identify the entire report where you want to apply the Power BI Filter.
2) Locate the "Filters" pane in Power BI.
3) Select the entire report by clicking on a blank area within the report.
4) In the "Filters" pane, choose the desired fields and specify the Filter criteria for each field.
5) Power BI will update all visuals and pages in the report, displaying data that matches the applied Filter criteria.
1) Applying Time Intelligence Filters
Here are the detailed steps to apply Time Intelligence Filters in the Power BI Software. The following points can better help you grasp the procedure:
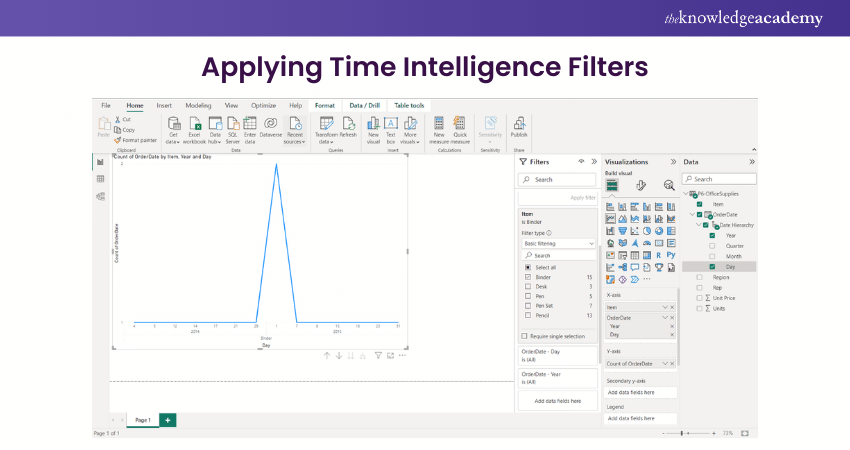
The steps to apply the Year-to-Data Filter are as follows:
1) Identify the visual or dataset with time-based data.
2) Locate the "Filters" pane in the BI tool.
3) Select the visual or dataset to activate it.
4) In the "Filters" pane, choose the time-based field, such as "Date" or "Year."
5) Select the "Year-to-Date" option or specify the desired period.
6) BI will dynamically update the data view, showing data only for the selected Year-to-Date period.
The steps to apply the Rolling Average Filter are as follows:
1) Identify the visual or dataset with time-based data.
2) Locate the "Filters" pane in the BI tool.
3) Select the visual or dataset to activate it.
4) In the "Filters" pane, choose the time-based field, such as "Date" or "Month."
5) Select the "Rolling Average" option or specify the desired time window.
6) BI will dynamically calculate the Rolling Average and update the data view accordingly.
2) Top N Filters
The implementation of Top N filters in Power BI necessitates following certain essential procedures. Here are the detailed steps to apply top N filters in the Power BI software.
The steps to apply the Top N filter are as follows:
1) Identify the visual or dataset where you want to apply the Power BI Filter.
2) Locate the "Filters" pane in BI.
3) Select the visual or dataset to activate it.
4) In the "Filters" pane, choose the field on which you want to apply the top N filter, such as "Sales Amount."
5) Specify the top values you want to display, such as the top 10.
6) BI will dynamically update the data view, showing only the top N values based on the specified measure.
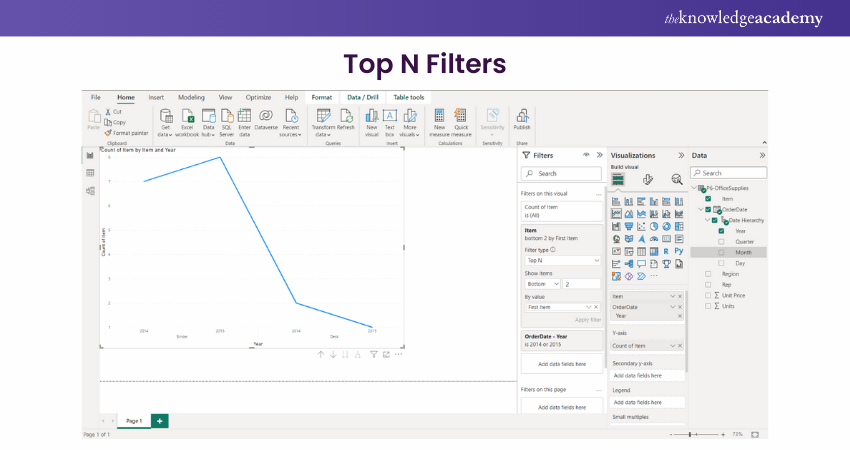
The steps to apply the Bottom N Filter are as follows:
1) Identify the visual or dataset where you want to apply the Power BI Filter.
2) Locate the "Filters" pane in BI.
3) Select the visual or dataset to activate it.
4) In the "Filters" pane, choose the field on which you want to apply the Bottom N Filter, such as "Sales Amount."
5) Specify the number of bottom values you want to display, such as the bottom five.
6) BI will dynamically update the data view, showing only the Bottom N values based on the specified measure.
What is Cross filtering?
This Power BI function eliminates all data and saves the ones you wish to concentrate on. Stated differently, this functionality redraws the chart according to the selected filter. The cross filtering in Power BI empowers informed decision-making and actionable insights across various levels of analysis. It refines data at different levels-
a) Visual
b) Page
c) Report
Modes of Filters: Basic and Advanced
There are two filtering modes in Power BI. Let’s explore them in detail:
a) Basic Filtering: It offers you an expandable and searchable list. To find a value, all you need to do is type a word or identifier into the search field. In exchange, the search terms you typed cause an instantaneous update of the list of accessible values.
b) Advanced Filtering: This mode lets you choose more precisely what you wish to filter out. Advanced filtering options also differ depending on the type of columns used.
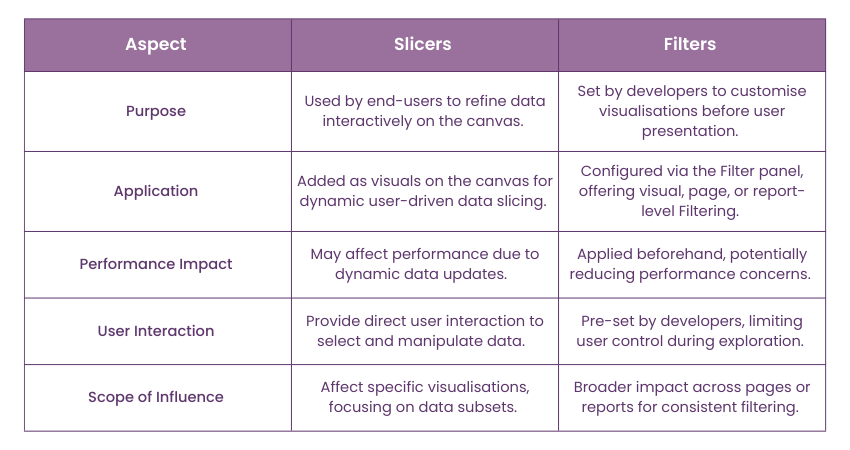
Power BI Slicer vs Filter
While Slicer and Filter share minimal similarities in terms of data segmentation and filtering, there are significant variations between them. Let’s explore those differences in detail:
Comparison of Filter Types
Filters are a fundamental component of visualisation tools like Power BI, enabling users to refine and focus on specific subsets of data. Let's delve into a comprehensive comparison of these filter types to understand their functionalities and advantages:
a) Automatic Filters: When you construct a visual, automatic filters are applied to the filter pane's visual level automatically. The fields that comprise your visual are the basis for these filters. With editing permissions to the report, users can edit, clear, hide, lock, rename, and sort this filter in the pane.
b) Manual Filters: When editing a report, you can drag and drop the manual filters into any area of the filter pane. These filters in the pane can be edited, deleted, cleared, hidden, locked, renamed, or sorted.
c) More Advanced Filters: Though less frequent, you should be aware of these filter kinds if your report includes them. While designing the perfect filter for your report, you might find them helpful.
d) Include and Exclude Filters: When you utilise a visual's include or exclude feature, the corresponding filters are automatically added to the filter pane. This filter in the pane can be sorted, locked, deleted, or hidden if you can alter reports. Also, such filters cannot be edited, cleared, or renamed.
e) Drill-down Filters: Drill-down filters are added to the filter pane automatically while using it for a report. You can modify or remove the filter in the pane if you are able to edit a report. This filter is linked to the drill-down features of visuals; thus, you cannot delete, hide, lock, rename, or sort it.
f) Cross-drill Filters: Cross-drill filters are automatically added to the pane when a drill-down filter from the report page is applied to another visual using a cross-filter. This filter is linked to the drill-down functionality. Even though you can edit a report, you cannot remove, clear, hide, lock, rename, or sort it.
g) Drillthrough Filters: This feature can pass drillthrough filters from one page to another since the Drillthrough pane displays them. Drillthrough filters come in two varieties and are activated by the first type. This kind of filter can be edited, deleted, cleared, and hidden, just like any other report. Depending on the source page's page-level filters, the second kind is sent to the destination. Although this temporary drillthrough filter can be edited, deleted, and cleared, it cannot be hidden or locked for end users.
h) URL Filters: By adding a Uniform Resource Locator (URL) query parameter, URL filters are added to the pane. The filter in the pane can be edited, deleted, or cleared if you are able to edit a report. Because this filter is linked to the URL parameter, you are unable to hide, lock, rename, or sort it.
i) Pass-through Filters: Visual filters produced by Q&A are called pass-through filters. While editing reports, you can delete, hide, or sort these filters in the pane. But these filters cannot be locked, cleared, edited, or renamed.
Conclusion
In conclusion, Power BI Filters play a crucial role in Data Analysis and Visualisation by allowing you to refine your data views and focus on specific subsets of information. By understanding and effectively applying these Filters, you can uncover valuable insights, identify trends, compare data across different time periods, and highlight significant data points, enhancing the effectiveness of your Data Analysis endeavours.
Learn to resolve data quality issues with our course in Microsoft Power BI Data Analyst PL300 Course today!
Frequently Asked Questions
How do you Write a Query for Power BI Filters?

To write a query for Power BI filters, use the DAX Data Analysis Expressions (DAX) language. For example, use the FILTER function to apply conditions:
CALCULATE(SUM(Sales[Amount]), FILTER(Sales, Sales[Date] >= TODAY() - 30)).
This filters data for the last 30 days in a report.
What are the Best Practices for Using Power BI Filters?

The top recommendations for Power BI Filters involve implementing Filters at the correct level (report, page, or visual), utilising Slicers for interactive exploration, utilising relative Date Filters for time-based analysis, and keeping Filter complexity to a minimum to boost performance and enhance user experience (UX).
What are the Other Resources and Offers Provided by The Knowledge Academy?

The Knowledge Academy takes global learning to new heights, offering over 3,000 online courses across 490+ locations in 190+ countries. This expansive reach ensures accessibility and convenience for learners worldwide.
Alongside our diverse Online Course Catalogue, encompassing 19 major categories, we go the extra mile by providing a plethora of free educational Online Resources like News updates, Blogs, videos, webinars, and interview questions. Tailoring learning experiences further, professionals can maximise value with customisable Course Bundles of TKA.
What are the Related Courses and Blogs Provided by The Knowledge Academy?

The Knowledge Academy offers various Business Intelligence Reporting, including the Microsoft Power BI Course, Tableau Desktop Training, and DAX Training. These courses cater to different skill levels, providing comprehensive insights into Power BI Best Practices.
Our Office Application Blogs cover a range of topics related to Power BI, offering valuable resources, best practices, and industry insights. Whether you are a beginner or looking to advance your Power BI skills, The Knowledge Academy's diverse courses and informative blogs have got you covered.
What is The Knowledge Pass, and How Does it Work?

The Knowledge Academy’s Knowledge Pass, a prepaid voucher, adds another layer of flexibility, allowing course bookings over a 12-month period. Join us on a journey where education knows no bounds.
Upcoming Office Applications Resources Batches & Dates
Date
 Microsoft Power BI Course
Fri 28th Feb 2025
Fri 4th Apr 2025
Fri 16th May 2025
Fri 11th Jul 2025
Fri 19th Sep 2025
Fri 21st Nov 2025


 Top Rated Course


 If you wish to make any changes to your course, please


