We may not have the course you’re looking for. If you enquire or give us a call on +44 1344 203 999 and speak to our training experts, we may still be able to help with your training requirements.
Training Outcomes Within Your Budget!
We ensure quality, budget-alignment, and timely delivery by our expert instructors.

Imagine having a tool that can do everything from tracking your budget to analysing complex data—all in one place. That’s Excel, a powerful application that goes beyond simple spreadsheets. Whether you're balancing your personal finances, managing a project, or working with big data, Excel helps you organise, calculate, and visualise information with ease. So, let’s understand What is Excel.
It’s equipped with features like formulas, charts, and PivotTables that do the heavy lifting, so you can focus on what matters most. From simple calculations to complex data models, Excel adapts to your needs, making even the most daunting tasks feel like a breeze. In this blog, we’ll dive into What is Excel, what makes Excel so powerful, explore its key features, and reveal the many ways it can make your life easier.
Table of Contents
1) What is Excel? Excel Definition
2) History of MS Excel and its Evolution
3) Microsoft Excel Overview
4) Common Excel Use Cases
5) Key Features of Microsoft Excel – Terminologies and Components
6) Advanced MS Excel Capabilities
7) Excel Alternative or Competitors
8) MS Excel: Essential Formulas and Functions
9) Conclusion
What is Excel? Excel Definition
Microsoft Excel is the most dynamic spreadsheet application developed by Microsoft, which is normally used to arrange data or to conduct financial analysis. Its main features are inputting, managing, modelling, and charting data. Excel is widely utilised in finance and accounting owing to its robust and flexible nature for budgeting, forecasting, and analysis.
It allows multiple functions, formulas, and shortcuts that can help users get the job done even more productive and swift. Thus, this is highly essential in the realms of financial and accounting professional fields and other areas which call for the organisation and analysis of data.
Microsoft Excel Definition: Excel is a software program developed by Microsoft to organise numbers and data using spreadsheets with formulas and functions. It finds its application all over the world in financial analysis by businesses, from the minutest to the largest.
History of MS Excel and its Evolution
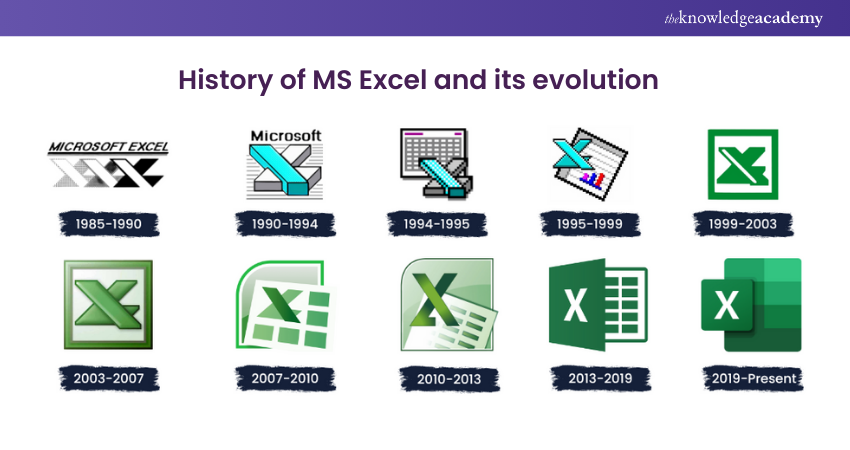
Microsoft Excel was introduced in 1985 as Microsoft Multiplan. It allowed the users to point and click using a graphical user interface. Compared to its competitors, such as Lotus 1-2-3, it also made it easier to alter, process and view spreadsheet data.
However, due to already available spreadsheet programmes, Microsoft Excel/Multiplan could did not gain much popularity on Microsoft Disk Operating System (MS-DOS). Thus, in 1987 Microsoft came up with version 2 of Excel, which outperformed its competitors in the market.
Further, it continued to evolve with version 3 in 1990 with features such as toolbars, 3D charts, drawing options and outlining capabilities. With version 4 and version 5, Excel caught people’s eyes as many new features were added.
Microsoft took a big leap in 2007 when it introduced a new ribbon menu system to Excel. Also, improved functions such as SmartArt set of diagrams, better management of named variables and more flexible graph formatting came into use.
Power View, Power Pivot and Flash Fill, and improved multithreading were introduced with version 15 in 2013. Version 16 is Excel’s most recent version, released in 2019, with which it has become one of the most widely used spreadsheet programmes across various sectors. It remains unbeatable with each new update.
Microsoft Excel Overview
Here is Microsoft Excel Basics overview which refer to the fundamental features and functionalities of it-
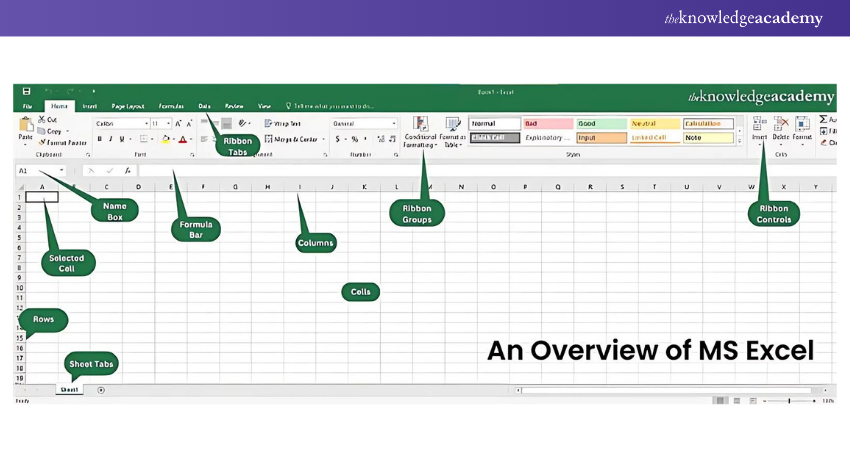
1) How to Open MS Excel?
The steps listed below should guide you on how to open Microsoft Excel on your computer:
a) Select "Start"
b) Then All Programs
c) The next step is to select MS Office
d) Lastly, select MS Excel as your choice
e) Alternately, click the Start button, then type MS Excel in the available search box
2) What is a Cell?
A spreadsheet looks like a table with rows and columns. A cell is a rectangular box formed by the intersection point of any two rows and columns. The smallest yet most precious unit in Excel is a cell.
Your data whether numbers or text can be typed, copied and pasted into the cell. Boundaries of size, text colour, background colour, and even more are all adjustable with a cell.
3) What is a Cell Address?
Cell address is the term referring to how a cell can be addressed. There is an important address for each cell whereby its column number and row number combine to provide the cell's address.
For example, the cell located at the intersection of column A and row 1 is addressed as A1. This system allows users to reference and manipulate specific cells easily within formulas and functions.
4) What is Worksheet?
A worksheet consists of several cells. It also possesses an invisible drawing layer, holding diagrams, charts, and pictures. Other worksheets are placed in the lower part of the window.
In addition to cells, a worksheet includes an invisible drawing layer that can contain diagrams, charts, and pictures. Multiple worksheets can be found within a single workbook, and they are typically displayed as tabs at the bottom of the Excel window.
5) What is Workbook?
In Microsoft Excel, a workbook is a standalone file. There are one or more worksheets within each workbook. This leads to the rather redundant terminology where a workbook is quite often referred to as a worksheet or collection of worksheets.
You can easily reorder your worksheets, add, or remove worksheets. Worksheets can be hidden without deleting them from the workbook and much, much more.
Common Excel Use Cases
Microsoft Excel is an indispensable tool in the business world, renowned for its versatility and powerful features. It is extensively used for a variety of tasks, from data entry and storage to complex Data Analysis and strategic planning.
Excel’s robust functionalities, such as graphing tools, pivot tables, and the macro programming language VBA, make it a go-to solution for professionals in finance, human resources, operations, and more.
Uses of MS Excel in Real Time Domains
Excel is applied to several uses within the business world. Below are some of the most popular use cases in real time domains are:
a) Business Analysis: Excel is critical in business Data Analysis in making correct decisions. It helps one find trends and predict future performance as well as assessing business strategies.
b) Human Resource Management: HR employees will handle employee information, track attendance, payroll computation and performance measures using Excel.
c) Operations Management: With Excel, operations can be managed by use of inventory lists, supply chains management, and production schedules optimisation.
d) Performance Reporting: Companies use Excel to prepare very detailed reports on performance that help them keep track of and analyse the efficiency and effectiveness of various departments.
Most importantly, its grid of cells organises and manipulates data in the most efficient manner. There exist various tools and features within the application, like graphing tools, pivot tables, and formulas, which help arrange and subsequently analyse the data. The application also contains a macro programming language known as Visual Basic for Applications that automates repetitive tasks.
Uses of MS Excel in Organisations
Use this application in a large variety of ways to accomplish work, such as:
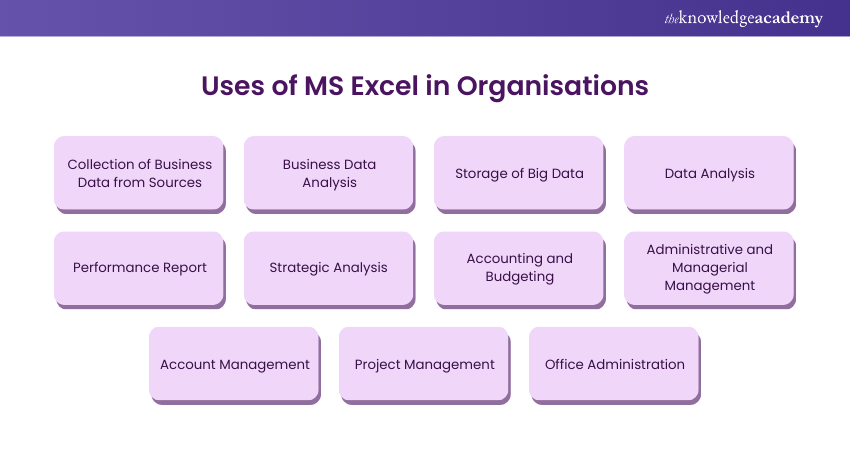
a) Collection of Business Data from Sources: Here, data is collected and validated using Excel so that the data collected will prove to be reliable and accurate.
b) Business Data Analysis: Great analysis through Excel ensures that a business is under scrutiny so that such collection efforts will provide support for strategic decisions taken.
c) Storage of Big Data: Excel facilitates storing big data sets which makes it easy to include data.
d) Data Analysis: The tools of analysis of Excel have a wide scope by which data can be interpreted so that insights as well as trends can be drawn.
e) Performance Report: Through performance reports prepared in Excel, different metrics and KPIs of organisations are analysed.
f) Strategic Analysis: The effectiveness of strategies by the companies along with their outcomes is analysed through Excel.
g) Accounting and Budgeting: Financial record management and budgeting make it easier to trace the expense items and revenues by using an Excel programme.
h) Administrative and Managerial Management: Through the scheduling and allotting resources, the administrative and managerial functions by Excel are supported.
i) Account Management: It controls customer as well as client accounts through Excel.
j) Project Management: The creation of a project and performance tracking can be done with the help of Excel, hence keeping a check on them.
k) Office Administration: Functions such as management of schedules, arranging meetings, etc. are undertaken by Excel to support office day-to-day activities.
These serve examples showing how useful and crucial Excel is in the operational tasks of the business world to enhance productivity and efficiency.
Master LibreOffice with us LibreOffice Training will enhance your productivity and skills today!
Key Features of Microsoft Excel – Terminologies and Components
Let's take a closer look at some of the important elements in Excel:
a) Cell: The basic unit in which data can be filled in is an intersection of column and row.
b) Cell Reference: A unique address assigned to a cell that is derived by combining the letter of the column with the number of the row; example A1, B2. Rows go across the screen horizontally and are numbered. Columns go up and down the screen vertically and are lettered.
c) Active Cell: Currently selected cell as shown by the green around the border.
d) Workbook: An Excel file that can comprise of one or more worksheets.
e) Worksheet: A single page that can be part of a workbook; it is a grid of cells. Each workbook can contain multiple worksheets.
f) Worksheet Tab: The arrangement of tabs along the bottom of the Excel window that allows a user to select which of several worksheets they'd like to view within one workbook.
g) Column and Row Headings: Letters and numbers down the left and across the top of the worksheet, respectively, that serve as column and row titles. By clicking a heading, the user selects an entire column or row.
h) Formula: A mathematical expression or function that is entered into a cell to derive information. All formulae start with an equal's sign (=).
i) Formula Bar: The bar directly above the worksheet where the user can type or edit the contents of cells and formulae, which is situated next to the "fx" label.
j) Address Bar: This is situated to the left of the formula bar and displays the cell reference of the active cell.
k) Filter: This is an attribute through which the user is allowed to disclose only the rows that satisfy some set of criteria that are applied. It can be under "Sort & Filter" in the Home ribbon tab.
l) AutoFill: An attribute that automatically fills cells through basing on the pattern of the cell selected. The pattern is applied to adjacent cells by users by dragging the fill handle, a small square that appears at the bottom right corner of the selected cell.
m) AutoSum: A feature that automatically adds up a range of cells. The user can highlight the cells to sum and hit Alt + =, or use the AutoSum button on the Home tab.
n) PivotTable: This is a strong tool to summarise and analyse data and to explore it. It's available under the Insert tab.
o) PivotChart: A chart format of a PivotTable in which the insights into the data will be graphical. It is also available under the Insert tab, right next to the option of PivotTable.
p) Source Data: The data in its virgin format that has been used to create a PivotTable or PivotChart.
All the above components and features in Excel turn it into a powerful tool for data organisation, analysis, and visualisations. Understanding the terms will provide a good grounding in using Excel in all business and personal applications effectively.
Advanced MS Excel Capabilities
Microsoft Excel is a powerful tool not only for storing data but also for performing complex computations and data recovery. It boasts several advanced features that enhance its functionality. Let’s explore some of these features in detail:
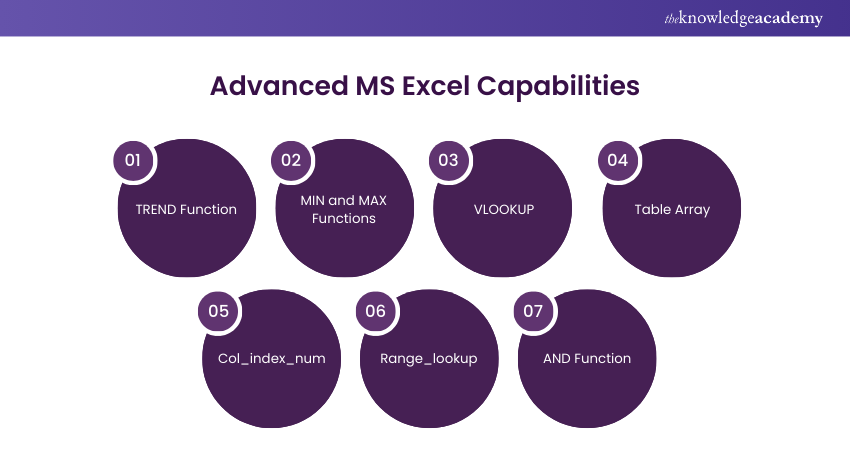
1) TREND Function: The TREND function is used to calculate linear trend lines through a set of Y or X values. This is particularly useful in industries for time series trend analysis or projecting future financial data. By identifying trends, businesses can make informed decisions based on historical data.
2) MIN and MAX Functions: These functions allow users to find the minimum and maximum values within a data set. The MIN function returns the smallest value, while the MAX function returns the largest. These functions are essential for Data Analysis, helping users quickly identify the range of their data.
3) VLOOKUP: The VLOOKUP (Vertical Lookup) function is designed to search for a value in the first column of a table and return a value in the same row from a specified column. This is incredibly useful for extracting data from large datasets and organising it into a new table. For example, you can use VLOOKUP to find a product price based on its ID.
4) Table Array: A Table Array consists of two or more tables with data and values that are linked and related to each other. It is a crucial component of the VLOOKUP function, as it defines the range of cells that VLOOKUP will search through to find the desired data.
5) Col_index_num: This parameter in the VLOOKUP function specifies the column number in the table array from which to retrieve the value. For instance, if you want to extract data from the third column of your table array, you will set the “col_index_num” to 3.
6) Range_lookup: The Range_lookup parameter in VLOOKUP determines whether you want an exact match or an approximate match. If set to TRUE, VLOOKUP will find the closest match to the lookup value. If set to FALSE, it will only find an exact match. This is useful when you need flexibility in your data searches.
7) AND Function: The AND function is used to include multiple criteria when searching for variables. It returns TRUE if all the conditions specified are met, and FALSE otherwise. The syntax for this function is “=AND(condition1, condition2, ...)”. This function is helpful in scenarios where you need to apply multiple conditions to filter your data.
Excel Alternative or Competitors
Although MS Excel is the best spreadsheet programme, other platforms also provide similar services, resulting in increased competition in the market. Some of them are:
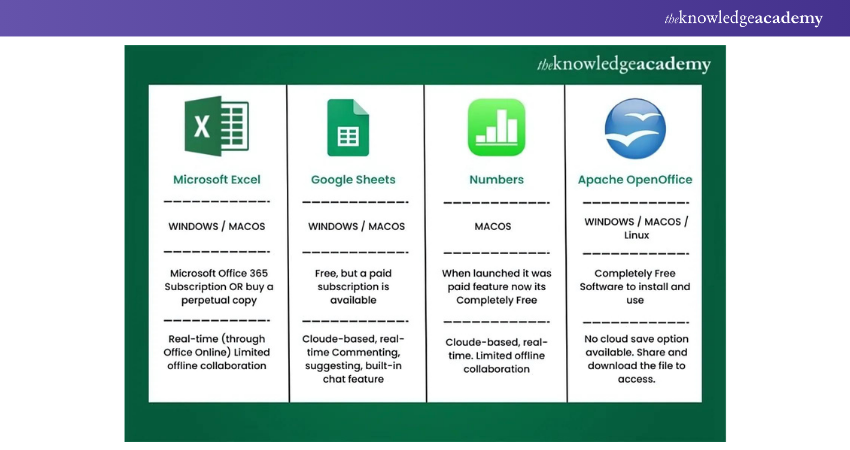
Google Sheets
Google Sheets is a strong competitor of Excel. It has similar layouts and features. Multiple users can access Google sheets and can work together from numerous devices.
Numbers
It is an Apple Spreadsheet program. It is available free to users around the world. Numbers cannot handle huge data sets while it has the best graphics and charts. Also, it is only available for Apple’s devices.
Apache OpenOffice Calc.
It is a free, open-source spreadsheet software with multiple features such as natural language formulas, Data Pilot, style and formatting, and multiple-user collaboration. It is available for Windows as well as macOS platforms.
Boost your productivity with our Google G Suite Training- register today for better efficiency!
MS Excel: Essential Formulas and Functions
Microsoft Excel formulas and functions ease the storage, manipulation, and recovery of data. To work hassle-free using Excel, it is important to know about its functions and formulas. So, let's have a look at them:
Functions of MS Excel
Some of the functions of MS Excel are:
1) NOT: Creates Reverse of a given logic. For example, !k = 15 means k = 15
Syntax: =NOT(logical)
Example: =NOT(A1=15) - This returns TRUE if A1 is not equal to 15.
2) IF: IF in an Excel spreadsheet determines a logical expression and returns its value for both Boolean results. The values are returned using two logical expressions TRUE or FALSE.
Syntax: =IF(logical_test, value_if_true, value_if_false)
Example: =IF(A1>10, "Greater", "Lesser") - This checks if A1 is greater than 10 and returns "Greater" if TRUE, otherwise "Lesser".
3) OR: Useful to check if any of the conditions is True. It returns the value as True if any expressions passed as its arguments are true. It will return FALSE if all the values are False.
Syntax: =OR(logical1, [logical2], ...)
Example: =OR(A1>10, B1<5) - This returns TRUE if either A1 is greater than 10 or B1 is less than 5.
4) Search: This function searches for a sub-string string and returns its position as a number.
Syntax: =SEARCH(find_text, within_text, [start_num])
Example: =SEARCH("a", "Cat", 1) - This returns 2 because "a" is the second character in "Cat".
5) IFERROR: IFERROR is a Logical function in MS Excel that checks the values for Error.
Syntax: =IFERROR(value, value_if_error)
Example: =IFERROR(A1/B1, "Error") - This returns "Error" if the division by B1 causes an error.
6) Arguments: They are the input values for Excel functions. It means that Excel functions use one or more arguments that will be used in the function programs as input data.
Arguments are the values or cell references provided to functions, like A1, "text", or 10.
7) Logical Functions: This function of Excel helps to check if an expression is True or False based on logic.
Logical functions like IF, AND, OR, and NOT are used to perform logical tests.
8) FIND: The FIND function returns the position as several of the given string inside the other string.
Syntax: =FIND(find_text, within_text, [start_num])
Example: =FIND("a", "Apple") - This returns 2, the position of "a" in "Apple".
Formulas in MS Excel
Following are the basic Excel formulas used in Excel to perform various calculations and analyse data:
1) SUM: The SUM formula is used to add values of the selected cells.
Syntax: =SUM(number1, [number2], ...)
Example: =SUM(A1:A10) - This adds the values from A1 to A10.
2) COUNT: To get the number of entries in a range or numbers, use COUNT.
Syntax: =COUNT(value1, [value2], ...)
Example: =COUNT(A1:A10) - This counts the number of numeric entries in A1 to A10.
3) AVG: An AVG formula gets the average of the arguments selected. For example, if the range C1:C20 contains numbers, the average of these values will be calculated as =AVERAGE (C1:C20)
Syntax: =AVERAGE(number1, [number2], ...)
Example: =AVERAGE(C1:C20) - This calculates the average of values from C1 to C20.
4) COUNTA: To count cells containing any information such as error values and empty texts COUNTA is used.
Syntax: =COUNTA(value1, [value2], ...)
Example: =COUNTA(A1:A10) - This counts the number of non-empty cells in A1 to A10.
5) LEN: It counts the characters present from the selected cells.
Syntax: =LEN(text)
Example: =LEN(A1) - This returns the number of characters in the text of cell A1.
6) TRIM: Using TRIM users can remove spaces from the text except for single spaces between words.
Syntax: =TRIM(text)
Example: =TRIM(A1) - This removes extra spaces from the text in A1.
7) NOW: To display current date and time or calculate value based on current time and date use NOW and you also change the date format.
Syntax: =NOW()
Example: =NOW() - This returns the current date and time.
8) ROUND: To round up the values of a cell use ROUND.
Syntax: =ROUND(number, num_digits)
Example: =ROUND(A1, 2) - This rounds the value of A1 to two decimal places.
9) CHOOSE: It returns a value from the list of specified positions or index numbers.
Syntax: =CHOOSE(index_num, value1, [value2], ...)
Example: =CHOOSE(2, "Red", "Green", "Blue") - This returns "Green" because it is the second value.
10) SUMIF and COUNTIF: COUNTIF applies criteria across multiple cell ranges and counts the number of cells that meet the criteria. Whereas SUMIF adds all its arguments that meet the criteria.
SUMIF: Syntax: =SUMIF(range, criteria, [sum_range])
Example: =SUMIF(A1:A10, ">10", B1:B10) - This sums the values in B1 where the corresponding values in A1 are greater than 10.
COUNTIF: Syntax: =COUNTIF(range, criteria)
Example: =COUNTIF(A1:A10, ">10")-This counts the cells in A1 that are greater than 10.
11) CELL, LEFT, RIGHT and MID: CELL calculates cells if they contain numeric values and returns zero if the cells contain text or is blank. LEFT returns the first character in a text string. RIGHT returns the last character and MID returns a specific number from a text string based on the characters specified by the user.
CELL: Syntax: =CELL(info_type, [reference])
Example: =CELL("type", A1) - This returns the type of value in A1.
LEFT: Syntax: =LEFT(text, [num_chars])
Example: =LEFT(A1, 3) - This returns the first three characters of A1.
RIGHT: Syntax: =RIGHT(text, [num_chars])
Example: =RIGHT(A1, 2) - This returns the last two characters of A1.
MID: Syntax: =MID(text, start_num, num_chars)
Example: =MID(A1, 2, 3) - This returns three characters from A1 starting at the second character.
12) XLOOKUP – it searches for a range and then returns the item relative to the first match it finds.
Syntax: =XLOOKUP(lookup_value, lookup_array, return_array, [if_not_found], [match_mode], [search_mode])
Example: =XLOOKUP("Item1", A1:A10, B1:B10, "Not Found") - This searches for "Item1" in A1 and returns the corresponding value from B1.
Take your spreadsheet skills to the next level with our Google Sheets Course-register now!
Conclusion
Excel isn’t just a spreadsheet tool—it's a powerhouse that transforms data into actionable insights. From tracking finances to building complex data models, Excel’s versatility makes it an essential tool for professionals and beginners alike. We hope with the help of this blog on What is Excel, you’ve gained a clearer understanding of Excel’s features and uses, empowering you to harness its full potential in your everyday tasks and projects.
Upgrade your proficiency with our comprehensive End User Training - join now for a brighter future!
Frequently Asked Questions

Many careers rely on Excel, including Data Analysts, accountants, Financial Planners, marketers, Project Managers, and Business Consultants. It’s also essential for roles in sales, HR, operations, and research, where organising, analysing, and visualising data is key to decision-making.

Boost productivity in Excel by learning keyboard shortcuts, using templates, and mastering functions like VLOOKUP, PivotTables, and conditional formatting. Automate repetitive tasks with macros, keep data organised with filters and tables, and regularly update your Excel skills.

The Knowledge Academy takes global learning to new heights, offering over 30,000 online courses across 490+ locations in 220 countries. This expansive reach ensures accessibility and convenience for learners worldwide.
Alongside our diverse Online Course Catalogue, encompassing 19 major categories, we go the extra mile by providing a plethora of free educational Online Resources like News updates, Blogs, videos, webinars, and interview questions. Tailoring learning experiences further, professionals can maximise value with customisable Course Bundles of TKA.

The Knowledge Academy’s Knowledge Pass, a prepaid voucher, adds another layer of flexibility, allowing course bookings over a 12-month period. Join us on a journey where education knows no bounds.

The Knowledge Academy offers various Microsoft Excel Courses, including Microsoft Excel Masterclass, Excel for Accountants Masterclass, and Business Analytics with Excel Masterclass. These courses cater to different skill levels, providing comprehensive insights into How to Use Excel.
Our Office Applications Blogs cover a range of topics related to Microsoft Excel, offering valuable resources, best practices, and industry insights. Whether you are a beginner or looking to advance your Excel skills, The Knowledge Academy's diverse courses and informative blogs have you covered.
Upcoming Office Applications Resources Batches & Dates
Date
 Microsoft Excel Course
Mon 13th Jan 2025
Mon 10th Mar 2025
Mon 7th Apr 2025
Mon 9th Jun 2025
Mon 8th Sep 2025
Mon 1st Dec 2025


 Top Rated Course


 If you wish to make any changes to your course, please


