We may not have the course you’re looking for. If you enquire or give us a call on +44 1344 203 999 and speak to our training experts, we may still be able to help with your training requirements.
We ensure quality, budget-alignment, and timely delivery by our expert instructors.

Picture the power to uncover hidden patterns, make predictions and have a confident peek into the future - all from a sample of data! This is made possible by Inferential Statistics. This branch of statistics empowers researchers to make bold conclusions about a population based on a data sample. From testing hypotheses to crafting confidence intervals, this field can teach you the art of drawing insightful conclusions.
This blog takes you on a journey through the world of Inferential Statistics, exploring its types, examples and more. So, read on and achieve statistical mastery in data-driven decision-making!
Table of Contents
1) What is Inferential Statistics?
2) Different Types of Inferential Statistics
3) Inferential Statistics Examples
4) Differences Between Inferential Statistics and Descriptive Statistics
5) Benefits of Using Inferential Statistics
6) What Can Inferential Statistics Tell Us?
7) Can I Use Both Inferential and Descriptive Statistics?
8) Conclusion
What is Inferential Statistics?
Inferential statistics is a powerful field of statistics that uses analytical tools to draw conclusions about a population through the examination of random samples. The prime goal of inferential statistics is to make generalisations about a population. In this field, a statistic is taken from the sample data (the sample mean) that is used to make inferences about the population parameter (the population mean).
Inferential Statistics leverage probability theory to assess the likelihood that conclusions drawn from a sample are applicable to the entire population. This field encompasses techniques like Hypothesis Testing, confidence intervals, and regression analysis to evaluate relationships and test predictions. These methods enable researchers and analysts to make informed decisions without needing to examine every individual in the population.
By employing Inferential Statistics, businesses, scientists, and policymakers can derive data-driven conclusions, thereby minimising the risk of errors in decision-making. Unlike descriptive statistics, which focus on summarising data, Inferential Statistics delve deeper by analysing trends, making forecasts, and identifying patterns within datasets. This makes it an essential tool in fields such as healthcare, market research, and social sciences.
Different Types of Inferential Statistics
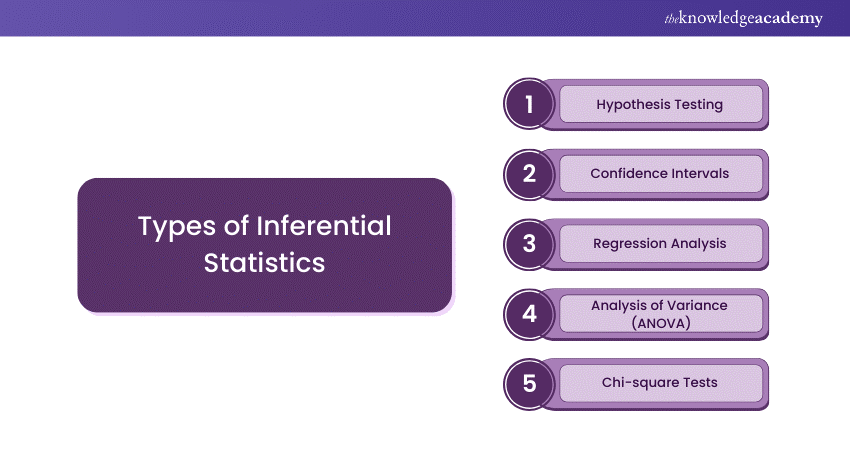
Inferential statistics consists of several techniques for drawing conclusions, including confidence testing, regression analysis and hypothesis testing. Let's explore them in detail

1) Hypothesis Testing
Hypothesis testing is a fundamental technique for testing a hypothesis about a population parameter (e.g., a mean) using sample data. This process involves these two steps:
a) Setting up alternative or null hypotheses
b) Conducting a statistical test to determine whether there's reasonable evidence for rejecting the null hypothesis in favour of the alternative hypothesis.
Example: A researcher might hypothesise that the average income of people in a certain city is more than £40,000 per year. Then, a sample of incomes will be collected and a hypothesis test will be conducted. This will help the researcher determine whether the data provides enough evidence to support or reject this hypothesis.
2) Confidence Intervals
Confidence Intervals provide a broad range of values within which a population parameter lies and a level of confidence associated with the range. They are used to estimate a population parameter's true value based on sample data. The confidence interval's width depends on the sample size and the desired confidence level.
Example: A poller may use a confidence interval to estimate the voter proportion who supports a particular candidate. It would provide a range of values within which the proportion of supporters is likely to lie, along with a confidence level such as 85%.
Want to gain expertise in forecasting future business outcomes? Sign up for our Introduction to Business Analytics Training now!
3) Regression Analysis
Regression Analysis evaluates the relationship between one (or more) independent variables and a dependent variable. It can:
a) Predict the dependent variable's value based on the values of the independent variables.
b) Allow for testing hypotheses regarding the strength of relationships between variables.
Example: A researcher can use regression analysis to examine the relationship between exam scores and hours of study. They can then use the regression model to make predictions about exam scores based on the hours studied.

4) Analysis of Variance (ANOVA)
ANOVA is a technique for comparing means across two or more groups. It analyses whether there are any statistically significant differences among the groups' means. To determine if observed differences were caused by chance or they represent true differences between groups, ANOVA calculates:
a) Between-group variance (variation between the group means)
b) Within-group variance (variation within each group)
Example: Researchers can use ANOVA to compare the effectiveness of various teaching methods on student performance. They could collect student performance data in each group and use ANOVA to determine whether there are any significant differences in performances between the groups.
5) Chi-square Tests
Chi-square Tests help determine whether there's a significant association between two categorical variables. They compare the data's observed frequency distribution to the expected frequency distribution under null hypothesis of independence.
Example: A researcher can utilise a chi-square test to examine whether there is a relationship between voting preference and gender. They would collect data from a sample of voters and determine whether gender and voting preference are independent.
Master the craft of designing Statistical Process Control (SPC) systems in our comprehensive Statistical Process Control Course - Sign up now!
Inferential Statistics Examples
Here are two examples of the usage of inferential statistics:
1) Education: Let's say a researcher collects data on the SAT scores of 12th graders in a school for four years. They utilise descriptive statistics to receive a quick overview of the school’s scores within those years. Then, the mean SAT score can be compared with the mean scores of other schools.
2) Corporate Sector: Let's say a researcher wants to learn about the average number of paid vacation days that a company's employees receive. Following the collection of survey responses from a random sample, they calculate a point estimate and confidence interval. Point estimate of the mean paid vacation days is the sample mean of 18 paid vacation days. Through random sampling, a 95% confidence interval of [16 21] means that the average number of vacation days can be confidently stated to be between 16 and 21.
3) Medical Research: Let's say a pharmaceutical company is in the testing phase of a new drug. They collect a sample of 1,000 volunteers to participate in a clinical trial, out of which 750 reported a significant reduction in their symptoms after consuming the drug. Using inferential statistics, the company can infer that the drug is likely to be effective for the larger population.
Discover essential statistical tools and techniques with the Statistics PDF. Get it today!
Differences Between Inferential Statistics and Descriptive Statistics
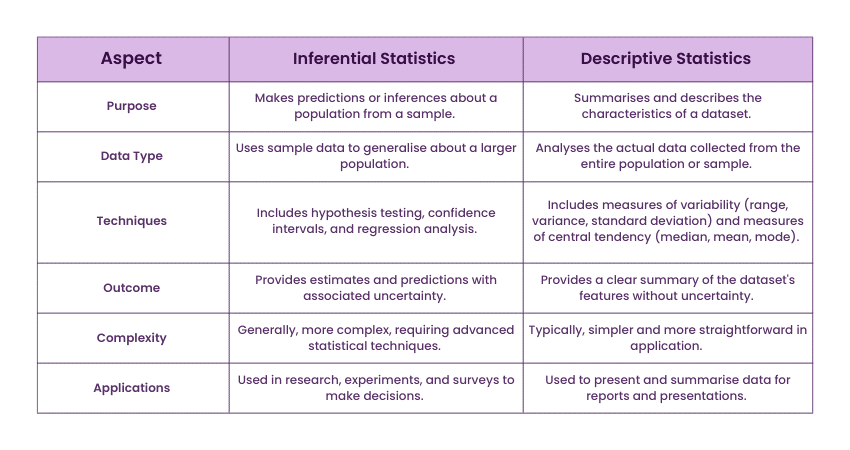
The following table summarises the key distinctions between inferential statistics and descriptive statistics:

Benefits of Using Inferential Statistics
Inferential Statistics help draw conclusions about a population from a sample, enabling data-driven predictions and decisions. Here are the key benefits:
a) Generalisation: Allows conclusions about a large population based on a smaller sample, saving time and resources.
b) Hypothesis Testing: Enables researchers to test theories and determine statistical significance in studies.
c) Predictive Insights: Facilitates forecasting and decision-making by analysing trends and relationships within data.
d) Error Reduction: Uses probability models to quantify uncertainty and minimise errors in conclusions.
e) Efficient Data Analysis: Extracts meaningful insights from limited data, making research and business decisions more effective.
What Can Inferential Statistics Tell Us?
Inferential Statistics allow us to draw conclusions about a population based on a sample. They enable us to make predictions, test hypotheses, and determine relationships between variables using techniques such as confidence intervals and significance testing.
Can I Use Both Inferential and Descriptive Statistics?
Absolutely! Descriptive Statistics help summarise and organise data, while Inferential Statistics analyse it to make predictions or generalisations beyond the dataset. Using both together provides deeper insights and more accurate conclusions.
Conclusion
Inferential Statistics serves as a reliable bridge between sample data and broader insights into the population. Techniques like hypothesis testing and confidence intervals empower researchers to make informed predictions and data-driven decisions. As detailed in this blog, embracing this tool will enhance your understanding of data and its implications in diverse fields.
Master the essential techniques for optimising business decision-making in our Mathematical Optimisation for Business Problems Course - Sign up now!
Frequently Asked Questions
Why is Inferential Statistics Better?

Inferential Statistics enables us to generalise findings from a sample to a broader population. This is especially useful when it’s impractical to collect data from every member of the population.
What is the Main Purpose of Inferential Statistics?

The key purposes of Inferential Statistics include:
a) Generalisation of findings from a sample
b) Hypothesis Testing
c) Estimation on population parameters
d) Predictions based on current data trends
What are the Other Resources and Offers Provided by The Knowledge Academy?

The Knowledge Academy takes global learning to new heights, offering over 3,000 online courses across 490+ locations in 190+ countries. This expansive reach ensures accessibility and convenience for learners worldwide.
Alongside our diverse Online Course Catalogue, encompassing 19 major categories, we go the extra mile by providing a plethora of free educational Online Resources like News updates, Blogs, videos, webinars, and interview questions. Tailoring learning experiences further, professionals can maximise value with customisable Course Bundles of TKA.
What is The Knowledge Pass, and How Does it Work?

The Knowledge Academy’s Knowledge Pass, a prepaid voucher, adds another layer of flexibility, allowing course bookings over a 12-month period. Join us on a journey where education knows no bounds.
What are the Related Courses and Blogs Provided by The Knowledge Academy?

The Knowledge Academy offers various Business Analyst Courses, including the Business Process Mapping Training and the Statistical Process Control Course. These courses cater to different skill levels, providing comprehensive insights into Descriptive Statistics.
Our Business Analysis Blogs cover a range of topics related to statistics, offering valuable resources, best practices, and industry insights. Whether you are a beginner or looking to advance your statistics skills, The Knowledge Academy's diverse courses and informative blogs have got you covered.
Upcoming Business Analysis Resources Batches & Dates
Date
 Statistics Course
Fri 25th Apr 2025
Fri 20th Jun 2025
Fri 22nd Aug 2025
Fri 17th Oct 2025
Fri 19th Dec 2025


 Top Rated Course


 If you wish to make any changes to your course, please


