We may not have the course you’re looking for. If you enquire or give us a call on +27 800 780004 and speak to our training experts, we may still be able to help with your training requirements.
We ensure quality, budget-alignment, and timely delivery by our expert instructors.

Are you tired of the same old dashboards and ready to explore the world of Data Visualisation beyond Grafana? Then, good news! Grafana is not the only star in the data monitoring landscape. From powerful real-time AI-driven insights to sleeker business intelligence dashboards, this blog rounds up the features and benefits of 18 Grafana Alternatives that suit diverse needs and industries. Whether you are optimising infrastructure, analysing metrics, or driving decision-making, your options are wide open and exciting. So read on and redefine how we see data!
Table of Contents
1) What is Grafana?
2) Best Grafana Alternatives for 2023
a) Instana
b) DataDog
c) NewRelic
d) D3.js
e) Power BI
f) Kibana
g) Tableau
h) QlikView
i) Knime
j) Redash
k) Charted
l) Dygraphs
3) Conclusion
What is Grafana?
Grafana is an open-source analytics and monitoring platform that integrates with various data sources, providing users with a centralised and visually appealing way to track, analyse, and understand metrics over time. With its extensive plugin ecosystem and flexible features, Grafana is a powerful tool for Data Visualisation, dashboard creation, and alerting.
Advantages of Grafana
Grafana offers several advantages, making it a popular choice for monitoring and analytics. Its key strengths include:
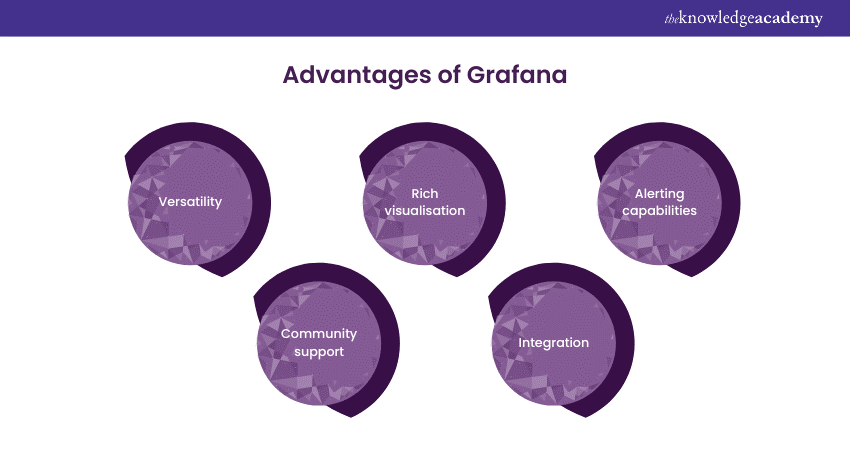
a) Versatility: Grafana supports many data sources, including popular databases, Cloud services, and custom applications, ensuring compatibility with diverse systems.
b) Rich Visualisation: The platform provides various visualisation options, from simple graphs to complex, interactive dashboards, allowing users to represent Data in a meaningful and customisable manner.
c) Alerting Capabilities: Grafana's alerting features empower users to set up notifications based on specified thresholds, ensuring timely responses to critical events.
d) Community Support: With an active user community, Grafana benefits from frequent development and updates, along with a rich set of shared plugins and dashboards.
e) Integration: Grafana seamlessly integrates with other monitoring tools and services, enhancing its functionality within different ecosystems.
Disadvantages of Grafana
While Grafana excels in many areas, it has some limitations:
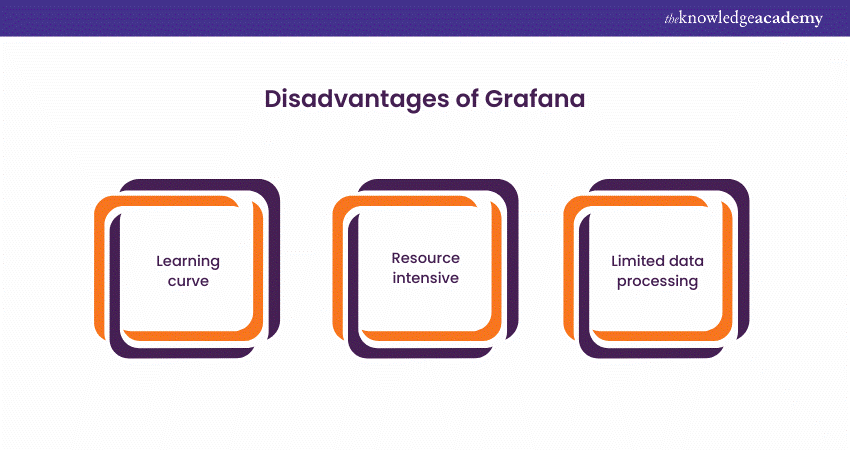
a) Learning Curve: New users may find Grafana's features overwhelming, requiring time and effort to master the platform effectively.
b) Resource Intensive: Running Grafana with multiple data sources and complex dashboards can demand substantial system resources, impacting performance.
c) Limited data Processing: Grafana focuses on visualisation rather than data processing, which may limit its suitability for certain analytical tasks.
Ace Your Next Interview with These Top Grafana Interview Questions!
Top 18 Grafana Alternatives
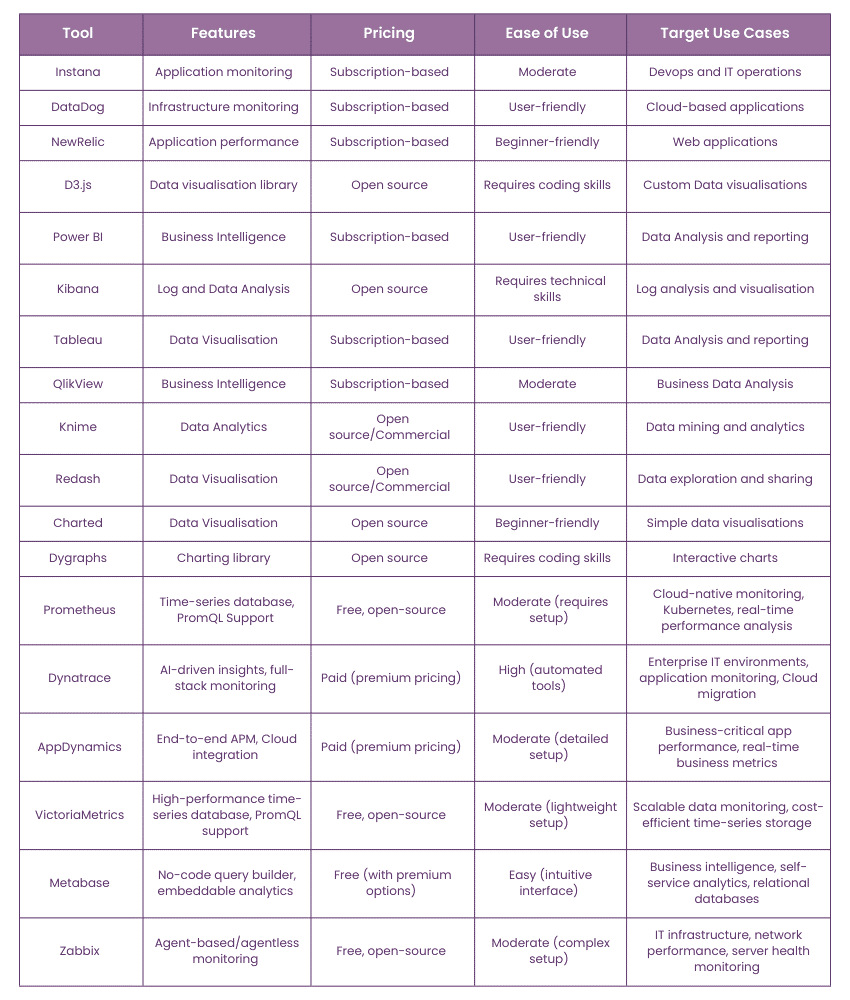
The following table summarises the best Grafana Alternatives:
Master the skills to create interactive reports and dashboards in Power BI through our Microsoft Power BI Course - Sign up now!
1) Instana
Instana is a comprehensive observability platform that has gained prominence for its automatic discovery and monitoring capabilities, especially in microservices and containerised environments. Its real-time insights and robust performance monitoring make it a valuable Grafana alternative.
Key Features:
a) Automatic discovery of microservices and containers.
b) Real-time application performance monitoring.
c) Seamless integration with Grafana for enhanced visualisation.
Use Cases:
Instana is particularly beneficial for organisations relying on microservices architecture. Its automatic discovery feature simplifies monitoring in dynamic environments.
Advantages:
Instana's automatic discovery and real-time insights set it apart, providing a more proactive approach to monitoring compared to Grafana's visualisation-centric focus.
Disadvantages:
While powerful, Instana might be perceived as more complex, and organisations with more straightforward monitoring needs might find it overkill.
Grafana vs Kibana: Which Tool Fits Your Data Visualization Needs?
2) DataDog
DataDog is a Cloud-based monitoring and analytics platform that provides comprehensive visibility across applications, infrastructure, and logs. Known for its collaboration features and user-friendly interface, DataDog stands as a versatile Grafana substitute.
Key Features:
a) Anomaly detection for early issue identification.
b) Log Management and analytics.
c) Application Performance Monitoring (APM) for detailed insights.
Use Cases:
DataDog is suitable for organisations looking for a comprehensive monitoring solution that covers various aspects, including infrastructure, logs, and applications.
Advantages:
DataDog excels in user-friendly collaboration and offers features like anomaly detection and Log Management, providing a holistic monitoring experience.
Disadvantages:
Cost might be a factor for some organisations, as DataDog can be relatively expensive based on usage.
3) NewRelic
NewRelic is a specialised application performance monitoring platform offering deep visibility into the performance of web applications. Its powerful analytics and intuitive interface make it the preferred choice for those seeking alternatives to Grafana.
Key Features:
a) Application performance monitoring for detailed insights.
b) Accurate user monitoring to understand end-user experiences.
c) Infrastructure monitoring to track server performance.
Use Cases:
NewRelic is ideal for organisations focused on optimising the performance of their web applications, making it a valuable tool for DevOps teams.
Advantages:
NewRelic's specialised focus on application performance monitoring tools provides in-depth insights that Grafana might not offer out of the box.
Disadvantages:
Like DataDog, cost might be a factor for smaller organisations or those with budget constraints.
4) D3.js
D3.js is not a complete monitoring solution; it is a JavaScript library for creating dynamic and interactive data visualisations in the web browser. While not a direct replacement for Grafana, it is often used with other tools to build custom visualisations.
Key Features:
a) JavaScript library for creating custom data visualisations.
b) Extensive support for building interactive charts and graphs.
Use Cases:
D3.js is suitable for organisations or developers looking to create highly customised and interactive visualisations tailored to their needs.
Advantages:
D3.js provides unparalleled flexibility in creating custom visualisations, allowing organisations to build unique, tailored dashboards.
Disadvantages:
The learning curve for D3.js can be steep for those without extensive JavaScript and data visualisation experience.
5) Power BI
Microsoft Power BI is a tool for business analytics that offers interactive visualisations and business intelligence capabilities. Users can create insightful reports and dashboards, providing a different approach than Grafana.
Key Features:
a) Business analytics with a focus on creating interactive dashboards.
b) Integration with various data sources for comprehensive insights.
c) Collaboration features for team-based analytics.
Use Cases:
Power BI is well-suited for organisations heavily invested in the Microsoft ecosystem and seeking a business intelligence tool with solid visualisation capabilities.
Advantages:
Power BI's strength lies in its business intelligence features, making it a preferred choice for organisations looking beyond traditional monitoring.
Disadvantages:
Integration challenges might arise for organisations not heavily invested in the Microsoft ecosystem.
Hone your Data Analysis skills with our comprehensive Business Intelligence Reporting Courses – Register now!
6) Kibana
Kibana, part of the Elastic Stack, is known for its robust log analysis and visualisation capabilities. It seamlessly integrates with Elasticsearch, making it a compelling choice for log-centric monitoring needs.
Key Features:
a) Log analysis and visualisation.
b) Integration with Elasticsearch for robust data storage and retrieval.
c) Dashboard creation for real-time insights.
Use Cases:
Kibana is particularly beneficial for organisations relying on Elasticsearch for log storage and analysis, making it a crucial component of the Elastic Stack.
Advantages:
Kibana's strength in log analysis, especially with Elasticsearch, sets it apart for organisations with extensive logging needs.
Disadvantages:
While robust for log analysis, Kibana might not provide the same breadth of features as Grafana for diverse monitoring needs.
7) Tableau
Tableau is a powerful Data Visualisation platform that enables users to create interactive, shareable dashboards. With a focus on business intelligence, it offers robust visualisation options and supports various data sources.
Key Features:
a) Data visualisation with a focus on business intelligence.
b) Interactive dashboards for comprehensive insights.
c) Extensive support for various data connectors.
Use Cases:
Tableau is ideal for organisations prioritising business intelligence and seeking advanced visualisation features for their data.
Advantages:
Tableau's focus on business intelligence and advanced visualisation features makes it the go-to choice for organisations emphasising data storytelling.
Disadvantages:
Like Power BI, integration challenges might arise for organisations that are not aligned with Tableau's ecosystem.
8) QlikView
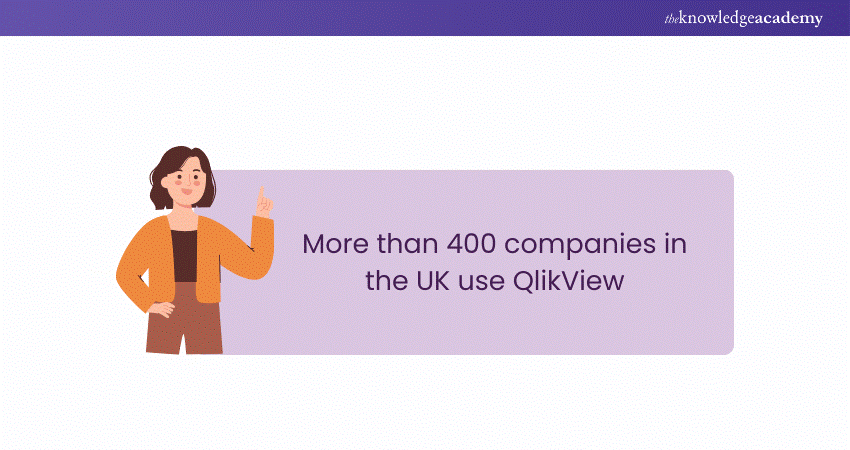
QlikView is a business discovery platform that facilitates interactive Data Visualisation and exploration. It emphasises user-driven analytics and associative data modelling, distinguishing it from Grafana in terms of approach.
Key Features:
a) Business discovery for user-driven analytics.
b) Associative data modelling for in-depth exploration.
c) Collaboration features for team-based analytics.
Use Cases:
QlikView is suitable for organisations looking for a user-driven analytics platform that allows end-users to explore and discover insights.
Advantages:
QlikView's focus on user-driven analytics and associative data modelling provides a different approach than Grafana's visualisation-centric model.
Disadvantages:
Complex data models might require a learning curve, and organisations seeking simplicity might find other tools more suitable.
9) Knime
Knime is an open-source platform enabling users to perform Data Analytics, reporting, and integration. It is a powerful tool for data scientists and analysts alike. It provides a visual interface for creating data workflows, making it a suitable alternative for those seeking a different workflow-based approach.
Key Features:
a) An open-source platform for Data Analytics.
b) Visual interface for creating data workflows.
c) Integration with various data sources for comprehensive analytics.
Use Cases:
Knime is ideal for organisations seeking an open-source, workflow-based Data Analytics and integration platform.
Advantages:
Knime's workflow-based approach provides a different paradigm for Data Analytics, making it suitable for organisations with specific workflow requirements.
Disadvantages:
The open-source nature might mean less comprehensive support compared to commercial solutions.
10) Redash
Redash is an open-source tool designed for Data Visualisation and collaboration. It supports various data sources and offers a simple way to create shareable dashboards, making it an alternative for collaborative data exploration.
Key Features:
a) Open-source tool for Data Visualisation and collaboration.
b) Support for various data sources.
c) Simple dashboard creation for easy collaboration.
Use Cases:
Redash is suitable for organisations looking for an open-source solution emphasising collaboration and simplicity in data exploration.
Advantages:
Redash's focus on simplicity and collaboration makes it a preferred choice for organisations valuing ease of use.
Disadvantages:
While simple, Redash might not offer the same depth of features as Grafana, especially for complex monitoring needs.
Want to transform raw data into actionable insights with ease? Look no further! Our QlikView Training will help you out – Sign up now!
11) Charted
Charted is a straightforward tool for creating simple, shareable charts. While not as feature-rich as Grafana, it is a quick solution for users seeking simplicity and ease of use.
Key Features:
a) Simple tool for creating shareable charts.
b) Minimalistic approach for quick chart creation.
c) Shareable charts for easy collaboration.
Use Cases:
Charted is suitable for users seeking a quick, straightforward solution for creating and sharing simple charts.
Advantages:
Charted's simplicity and minimalistic approach make it an easy-to-use tool for basic charting needs.
Disadvantages:
Lacks the extensive features and customisation options offered by more robust solutions like Grafana.
12) Dygraphs
Dygraphs is a JavaScript library for creating interactive, zoomable charts. While it's more focused on visualisation, it can be integrated into web applications to display time-series data effectively.
Key Features:
a) JavaScript library for creating interactive charts.
b) Zoomable charts for in-depth exploration.
c) Time-series Data Visualisation capabilities.
Use Cases:
Dygraphs is ideal for organisations or developers looking for a JavaScript library to enhance time-series Data Visualisation in web applications.
Advantages:
Dygraphs provides specific capabilities for time-series Data Visualisation, offering a focused solution for organisations with such requirements.
Disadvantages:
Limited to time-series data and not as comprehensive as Grafana for diverse monitoring needs.
13) Prometheus
Originally developed at SoundCloud, Prometheus is an open-source monitoring (and alerting) toolkit. It has become a widely adopted solution for monitoring systems and services.
Key Features:
a) Time-series database with multidimensional data collection.
b) Powerful query language (PromQL).
c) Built-in alerting system.
d) Supports service discovery for dynamic environments.
Use Cases:
a) Monitoring Kubernetes clusters and Cloud-native applications.
b) Real-time performance analysis for microservices.
c) Infrastructure monitoring.
Advantages:
a) Open-source and free to use.
b) Integrates seamlessly with Grafana.
c) Highly scalable for modern, dynamic systems.
Disadvantages:
a) Lacks long-term storage out of the box (requires external solutions like Thanos).
b) Limited visualisation capabilities compared to Grafana.
14) Dynatrace
Dynatrace is a unified security and observability platform with strong Application Management capabilities. This tool provides insights into app performance, including error tracking, transaction monitoring, and request tracing.
Key Features:
a) AI-driven insights for automated problem detection.
b) Full-stack monitoring, including infrastructure, applications, and user experience.
c) Auto-discovery of dependencies.
d) Cloud-native monitoring and DevOps integration.
Use Cases:
a) Monitoring enterprise-level IT environments.
b) Application performance management (APM).
c) Cloud migration monitoring.
Advantages:
a) Highly automated with minimal manual configuration.
b) Provides deep insights with AI-powered analysis.
c) Scalable for large organisations.
Disadvantages:
a) Expensive for smaller teams or startups.
b) Steeper learning curve for non-technical users.
15) AppDynamics
AppDynamics is an APM tool that enables users to monitor application performance, find root causes for performance issues, gain visibility into application ecosystems, extract real-time data insights, and more.
Key Features:
a) Real-time business metrics monitoring and Data Analysis.
b) Monitoring and optimisation across Cloud-native and traditional infrastructures.
c) Network monitoring features to pinpoint performance issues across third-party networks.
d) APM features fix anomalies in real time, connect with teams on a single platform and manage hybrid environments.
e) Smart Agent to simplify application instrumentation through intelligent Lifecycle Management and agent automation.
Use Cases:
a) Identify and resolve performance bottlenecks across your entire application stack.
b) Understand interactions within microservices and identify issues in complex distributed systems.
c) DevOps Collaboration.
Advantages:
a) Provides deep application insights.
b) Great for monitoring business-critical applications.
c) Customisable dashboards and alerts.
Disadvantages:
a) High licensing costs.
b) Can be overwhelming for small-scale environments.
16) VictoriaMetrics
VictoriaMetrics is an open-source, high-performance time series database and monitoring solution for large-scale metrics data.
Key Features:
a) High-performance time-series database.
b) Supports PromQL and integrations with Prometheus tools.
c) Optimised for both real-time and long-term storage.
d) Lightweight and efficient resource usage.
Use Cases:
a) Long-term storage for time-series data.
b) Scalable monitoring for large datasets.
c) Alternative to Prometheus for cost-efficient setups
Advantages:
a) Faster ingestion and query speeds than some competitors.
b) Cost-effective and open-source.
c) Easily integrates with existing Prometheus setups.
Disadvantages:
a) Limited visualisation capabilities without third-party tools.
b) Smaller community compared to Prometheus.
17) Metabase
Metabase is an open-source BI and Data Visualisation tool for making data exploration accessible to everyone
Key Features:
a) Intuitive, no-code query builder.
b) Data Visualisation and dashboard creation.
c) Supports multiple databases like MySQL, PostgreSQL, MongoDB and Elasticsearch.
d) Embeddable analytics for applications.
Use Cases:
a) Business intelligence (BI) for non-technical users.
b) Self-service analytics for teams.
c) Quick insights from relational databases
Advantages:
a) Easy to use, even for non-technical users.
b) Open-source with a premium hosted option.
c) Offers embeddable dashboards for applications.
Disadvantages:
a) Limited to business intelligence and database queries.
b) Not suitable for real-time monitoring.
18) Zabbix
Zabbix is an enterprise-class, open-source monitoring solution for monitoring and tracking IT infrastructure performance and availability, including networks, servers, virtual machines, and Cloud services.
Key Features:
a) Agent-based and agentless monitoring.
b) Comprehensive support for infrastructure and network monitoring.
c) Customisable alerts and escalations.
d) Autodiscovery of network devices.
Use Cases:
a) IT infrastructure monitoring.
b) Network Performance Management.
c) Server health and availability tracking.
Advantages:
a) Open-source and free.
b) Extensive monitoring capabilities for diverse environments.
c) Scalable for both small and large setups.
Disadvantages:
a) Complex initial configuration.
b) Limited support for modern Cloud-native environments.
Conclusion
In conclusion, exploring Grafana Alternatives is a strategic move, allowing you to tailor your monitoring and visualisation tools to your unique requirements. Whether it's scalability, specific use cases, or cost considerations, these alternatives offer a diverse set of solutions. Choose wisely to optimise your Data Management and analysis endeavours.
Learn about software solutions to locate data, conduct analytics, and generate reports in our up-to-date Business Objects Reporting Course - Register now!
Frequently Asked Questions
Can I Use Prometheus Without Grafana?

Prometheus lacks a single pane of glass view. To achieve that, you need to use tools such as Grafana to visualise those metrics.
Can Kibana Replace Grafana?

If you are building a monitoring system, both can do the job well, though there are some differences. If you are after logs for any of the use cases that log support, such as forensics, development, troubleshooting, or security, Kibana is your only option.
What are the Other Resources and Offers Provided by The Knowledge Academy?

The Knowledge Academy takes global learning to new heights, offering over 3,000 online courses across 490+ locations in 190+ countries. This expansive reach ensures accessibility and convenience for learners worldwide.
Alongside our diverse Online Course Catalogue, encompassing 19 major categories, we go the extra mile by providing a plethora of free educational Online Resources like News updates, Blogs, videos, webinars, and interview questions. Tailoring learning experiences further, professionals can maximise value with customisable Course Bundles of TKA.
What is The Knowledge Pass, and How Does it Work?

The Knowledge Academy’s Knowledge Pass, a prepaid voucher, adds another layer of flexibility, allowing course bookings over a 12-month period. Join us on a journey where education knows no bounds.
What are the Related Courses and Blogs Provided by The Knowledge Academy?

The Knowledge Academy offers various Business Intelligence Reporting Courses, including the Business Intelligence Analyst Course and the Microsoft Power BI Course. These courses cater to different skill levels, providing comprehensive insights into Business Intelligence Developer.
Our Office Applications Blogs cover a range of topics related to Business Intelligence, offering valuable resources, best practices, and industry insights. Whether you are a beginner or looking to advance your Business Intelligence skills, The Knowledge Academy's diverse courses and informative blogs have got you covered.
Upcoming Office Applications Resources Batches & Dates
Date
 Grafana Training
Fri 16th May 2025
Fri 18th Jul 2025
Fri 19th Sep 2025
Fri 21st Nov 2025


 Top Rated Course


 If you wish to make any changes to your course, please


