We may not have the course you’re looking for. If you enquire or give us a call on +27 800 780004 and speak to our training experts, we may still be able to help with your training requirements.
Training Outcomes Within Your Budget!
We ensure quality, budget-alignment, and timely delivery by our expert instructors.

Ever categorised your favourite colour as red, blue, or green? This simple act involves Nominal Data. It's a type of data that represents categories or labels without any inherent order. Understanding What is Nominal Data is crucial for Data Analysis and making informed decisions.
By mastering the concepts of Nominal Data, you can extract valuable insights from your datasets, regardless of the field you work in. This blog will delve into What is Nominal Data alongside its characteristics, applications, and importance. Let's explore how this type of data can provide valuable insights.
Table of Contents
1) What is Nominal Data?
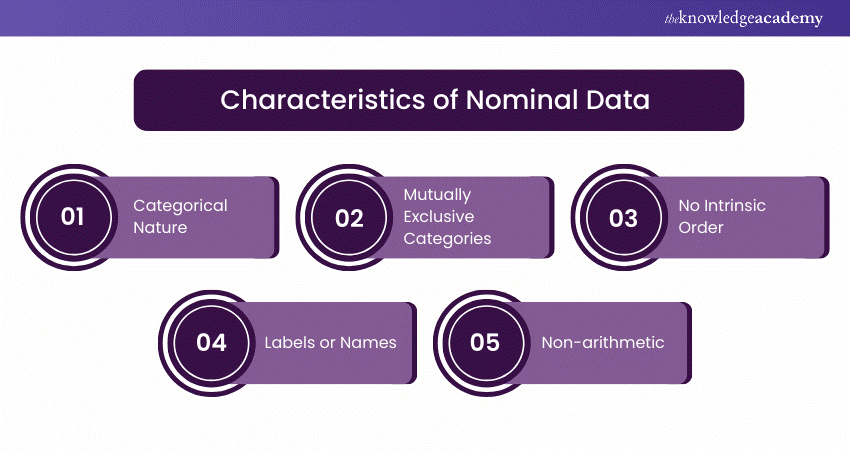
2) Characteristics of Nominal Data
3) Nominal Data Analysis
4) Nominal Data Examples
5) How can Nominal Data be analysed?
6) Methods to Collect Nominal Data and its Applications
7) Difference Between Nominal and Ordinal Data
8) Conclusion
What is Nominal Data?
Nominal Data, also known as categorical data, is a type of data used to label variables without providing any quantitative value. It is one of the simplest forms of data in statistics and is used to classify data into distinct categories. Each category is mutually exclusive, meaning that each data point can belong to only one category. Nominal Data is often used in surveys, questionnaires, and research studies to classify responses into different groups.
Characteristics of Nominal Data
Nominal Data is a fundamental type of data characterised by several distinct features:

a) Categorical Nature: Nominal Data is entirely categorical, meaning it represents discrete categories without any associated numerical values. It’s used for sorting data into distinct groups based on qualitative attributes rather than quantitative measures.
b) Mutually Exclusive Categories: Each data point can belong to only one category at a time. For example, in a survey on preferred pet types, a respondent can choose only one pet type, such as “dog” or “cat,” but not both simultaneously.
c) No Intrinsic Order: The categories in Nominal Data do not have any inherent order or ranking. For instance, the categories “red,” “blue,” and “green” in a colour preference survey do not imply a sequence or hierarchy.
d) Labels or Names: Nominal Data is often represented by labels or names, such as “male” and “female” for gender, or “urban,” “suburban,” and “rural” for residential areas. These labels simply identify different categories without implying any order.
e) Non-arithmetic: Arithmetic operations like addition, subtraction, multiplication, and division are not applicable to Nominal Data. The data is used purely for classification and comparison, not for quantitative analysis.
Nominal Data Analysis
In this section, we’ll explore how Nominal Data Analysis works.
Descriptive Statistics
Descriptive statistics for Nominal Data focus on summarising data by presenting frequencies and percentages. For example, if you collect data on the favourite colours of a group of people, you would tally how many individuals selected each colour.
This count is then converted into percentages to understand the proportion of each colour preference relative to the total sample. This approach helps in providing a clear overview of how often each category occurs, facilitating a straightforward comparison among categories.
Graphical Analysis
Graphical analysis is a powerful tool for visualising Nominal Data. Bar charts and pie charts are commonly used to represent such data. Bar charts display the frequency of each category, with bars of varying heights corresponding to the number of occurrences in each category.
This makes it easy to compare different categories visually. Pie charts, on the other hand, represent the proportion of each category as a slice of a whole pie, highlighting the relative sizes of each category within the dataset. These visualisations enhance understanding by presenting data in a format that is often easier to interpret than raw numbers.
Categorisation of Nominal Data
Graphical analysis is a powerful tool for visualising Nominal Data. Bar charts and pie charts are commonly used to represent such data. Bar charts display the frequency of each category, with bars of varying heights corresponding to the number of occurrences in each category.
This makes it easy to compare different categories visually. Pie charts, on the other hand, represent the proportion of each category as a slice of a whole pie, highlighting the relative sizes of each category within the dataset. These visualisations enhance understanding by presenting data in a format that is often easier to interpret than raw numbers.
Statistical Tests
To analyse relationships between categorical variables, statistical tests such as the Chi-square test and Fisher’s exact test are employed. The Chi-square test is used to determine whether there is a significant association between two categorical variables.
For example, it can assess whether there is a relationship between gender and preference for a specific product. Fisher’s exact test is used when sample sizes are small, providing a precise measure of association. Both tests are crucial for understanding the interactions between categorical variables and drawing meaningful conclusions from Nominal Data.
Advance your career — Register for our Business Analyst Courses today and become a data-driven decision-maker.
Nominal Data Examples
Here are some common examples of Nominal Data:
a) Gender: Male, Female, Other
b) Marital Status: Single, Married, Divorced, Widowed
c) Blood Type: A, B, AB, O
d) Eye Colour: Blue, Green, Brown, Hazel
e) Nationality: American, British, Canadian, Australian
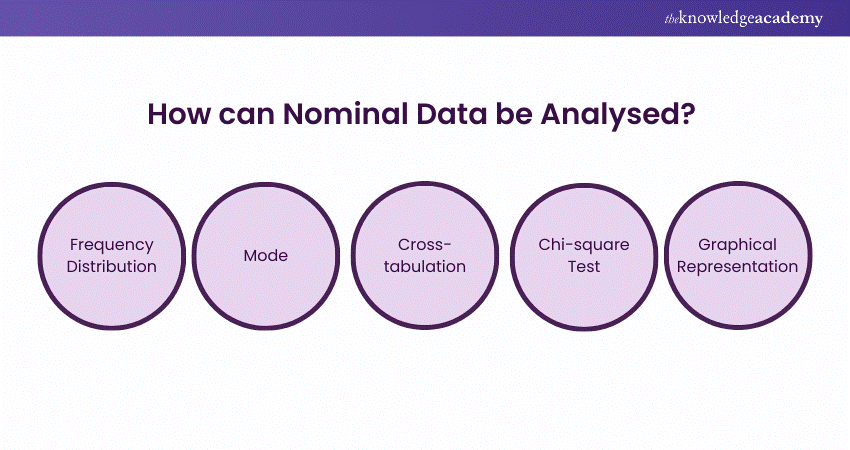
How can Nominal Data be Analysed?
Nominal Data can be analysed using several methods to gain insights:

a) Frequency Distribution: This involves counting the number of occurrences for each category within the dataset. By summarising how often each category appears, you can get a clear view of the data's distribution.
b) Mode: The mode is the most frequently occurring category in the dataset. Identifying the mode helps in determining the most common or popular category among the data points.
c) Cross-tabulation: This method involves creating a contingency table to explore the relationship between two nominal variables. It helps in understanding how different categories of one variable relate to those of another.
d) Chi-square Test: The Chi-square test assesses whether there is a significant association between two categorical variables, testing for independence and revealing if the variables are related or independent.
e) Graphical Representation: Bar charts and pie charts are used to visually represent Nominal Data. Bar charts show the frequency of each category with bars, while pie charts illustrate the proportion of each category within the total dataset, making it easier to compare and interpret data visually.
Maximise efficiency and profits—Join our Mathematical Optimisation for Business Problems Course and master the art of optimal decision-making
Methods to Collect Nominal Data and its Applications
Methods of collecting Nominal Data include various approaches, each suited to different contexts:
a) Surveys and Questionnaires: These tools gather responses to categorical questions, allowing respondents to select predefined options. They are effective for collecting structured data from a large number of participants, making it easy to analyse and classify responses into categories.
b) Interviews: Through interviews, responses to open-ended questions are recorded. This method provides qualitative data that can be categorised into nominal groups based on themes or topics discussed. Interviews offer deeper insights into individual perspectives and experiences.
c) Observations: Observational methods involve categorising behaviours or characteristics as they occur in real-time. For example, categorising types of interactions in a study group provides Nominal Data on the observed behaviours.
d) Administrative Records: Existing records, such as customer databases or organisational logs, are used to classify data into categories. This method leverages pre-existing information to sort and analyse Nominal Data without the need for new data collection.
Nominal Data finds diverse applications across various fields:
a) Market Research: In market research, Nominal Data is crucial for understanding consumer preferences and behaviours. By categorising respondents based on their product choices, brand preferences, or demographic characteristics, businesses can identify trends, target specific customer segments, and tailor marketing strategies effectively.
b) Healthcare: Healthcare relies on Nominal Data to classify patients according to demographic information such as age, gender, and ethnicity. This classification helps in organising patient records, assessing health trends across different groups, and providing tailored medical care based on categorical health factors.
c) Education: In education, Nominal Data is used to categorise students by grade level, major, or other attributes. This helps in tracking academic progress, organising educational resources, and studying educational outcomes based on different student categories.
d) Social Sciences: Social sciences utilise Nominal Data to group individuals into categories for studying social phenomena. By classifying people based on variables such as socio-economic status, occupation, or cultural background, researchers can analyse patterns, behaviours, and relationships within societies.
Unlock the power of data with our Introduction to Statistics Course. Join now and start your journey towards data-driven decision-making!
Difference Between Nominal and Ordinal Data
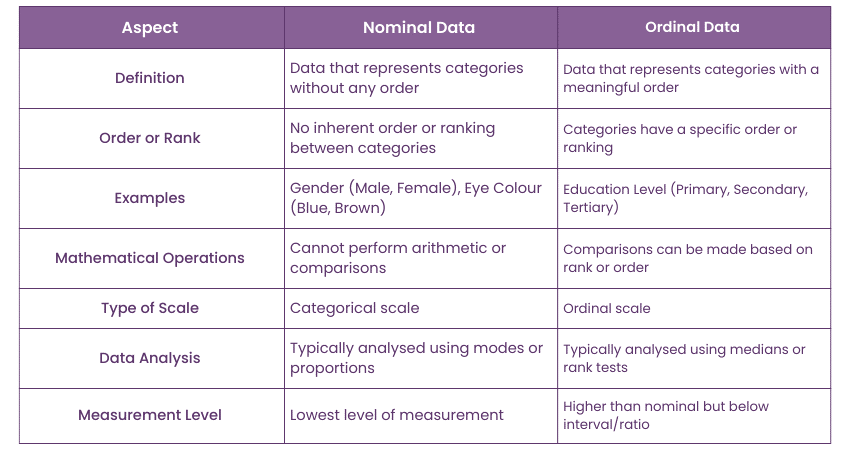
Nominal and ordinal data are both types of categorical data, but they have distinct differences.

Nominal Data represents categories without any intrinsic order or ranking. Each category is unique and mutually exclusive, such as gender, race, or colour preferences. The primary purpose is to classify data into distinct groups where no category is considered higher or lower than another. Arithmetic operations are not applicable.
Ordinal Data, on the other hand, involves categories with a meaningful order or ranking. The categories indicate a progression or level of intensity, such as educational attainment (e.g., high school, bachelor’s, master’s) or customer satisfaction ratings (e.g., poor, fair, good, excellent).
While the exact differences between categories are not quantified, the order is significant and reflects relative position. Unlike Nominal Data, ordinal data allows for some level of comparison based on the ranking of categories.
Conclusion
In conclusion, understanding What is Nominal Data is essential for anyone looking to grasp the basics of data classification and analysis. Whether you’re categorising survey responses, sorting customer preferences, or analysing qualitative data, this foundational knowledge equips you to manage and interpret information effectively. Now, with your passion for Data Analysis and a solid grasp of Nominal Data, you're ready to turn that knowledge into actionable insights.
Enhance quality management—Sign up for our Statistical Process Control Training today!
Frequently Asked Questions

The four types of data are nominal (categorical), ordinal (ranked), interval (measured with equal distances but no true zero), and ratio (measured with equal distances and a true zero).

Age is typically considered Ordinal because it has a meaningful order (e.g., child, teenager, adult) and can be ranked, though it is also measured on a ratio scale for precise calculations.

The Knowledge Academy takes global learning to new heights, offering over 30,000 online courses across 490+ locations in 220 countries. This expansive reach ensures accessibility and convenience for learners worldwide.
Alongside our diverse Online Course Catalogue, encompassing 19 major categories, we go the extra mile by providing a plethora of free educational Online Resources like News updates, Blogs, videos, webinars, and interview questions. Tailoring learning experiences further, professionals can maximise value with customisable Course Bundles of TKA.

The Knowledge Academy’s Knowledge Pass, a prepaid voucher, adds another layer of flexibility, allowing course bookings over a 12-month period. Join us on a journey where education knows no bounds.

The Knowledge Academy offers various Business Analyst Courses, including the Certified Business Analyst Professional (CBA-PRO) Course, Introduction to Statistics Course and the Introduction to Business Analytics Training. These courses cater to different skill levels, providing comprehensive insights into Standard Deviation in Statistics.
Our Business Analysis Blogs cover a range of topics related to Statistics, offering valuable resources, best practices, and industry insights. Whether you are a beginner or looking to advance your Business Analysis skills, The Knowledge Academy's diverse courses and informative blogs have got you covered
Upcoming Business Analysis Resources Batches & Dates
Date
 Statistics Course
Fri 21st Feb 2025
Fri 25th Apr 2025
Fri 20th Jun 2025
Fri 22nd Aug 2025
Fri 17th Oct 2025
Fri 19th Dec 2025


 Top Rated Course


 If you wish to make any changes to your course, please


