We may not have the course you’re looking for. If you enquire or give us a call on +27 800 780004 and speak to our training experts, we may still be able to help with your training requirements.
Training Outcomes Within Your Budget!
We ensure quality, budget-alignment, and timely delivery by our expert instructors.

Are you struggling to choose between Power BI and Tableau? Both are cutting-edge, popular platforms that offer a set of robust tools for transforming raw data into insightful visualised information with a myriad of features, such as data integration, visualisation, and analysis. Moreover, while Power BI is suitable for organisations that utilises Excel, Sharepoint, SQL Server, among other MS tools, Tableau is much better in terms of reporting and managing large volumes of data efficiently. However, the question that arises, which is a better data visualisation tool among Power BI vs Tableau? In this blog, we will raise the curtains from this query and help you understand the distinct definitions of both, their benefits and limitations, helping understand the Power BI vs Tableau debate in a detailed manner. Let’s glide in!
Table of Contents
1) What is Power BI?
2) What is Tableau?
3) What are the Advantages and Disadvantages of Power BI?
4) What are the Advantages and Disadvantages of Tableau?
5) Power BI vs Tableau: Key Differences
6) Which is Better- Power BI or Tableau?
7) Conclusion
What is Power BI?
Power BI is a Microsoft-operated service that helps users create interactive visualisations in business analytics. With its applications, users can seamlessly generate reports and dashboards from various data sources. It is also a great data preparation tool that enables ad hoc data analysis for any professional, ranging from business analysts to data scientists.
What is Tableau?
Tableau is a powerful data visualisation and Business Intelligence (BI) tool for creating interactive and visually appealing dashboards, reports, and charts. It also allows users to connect to various data sources, such as spreadsheets, databases, and cloud services, to analyse and present data in a clear manner.
Tableau offers several features, such as drag-and-drop functionality, dynamic filtering, and numerous chart types, which allow users to explore data and gain insights quickly. In addition, the tool is also widely used in finance, healthcare, and retail, among other industries, to help organisations make data-driven decisions seamlessly. A few of the Tableau’s strengths include:
1) User-friendly Interface: Tableau has the built-in intuitive drag-and-drop functionality that allows even beginners to create data visualisations and dashboards easily.
2) Powerful For Data Professionals: It enables business analysts and other professionals to explore and communicate insights from large datasets quickly.
3) Flexibility And Scalability: Tableau can easily connect to various data sources. This includes spreadsheets, databases, Salesforce, and Google Analytics.
4) Data Integration: It simplifies the process of merging multiple data sources, making it easier to identify patterns and correlations across datasets.
Excel in cutting-edge Business Intelligence skills with our Microsoft BI Training- register now!
What are the Advantages and Disadvantages of Power BI?
Power BI and Tableau are two of the widely utilised business intelligence (BI) tools, helping users to easily manage and organise data. Below, we have described the advantages and disadvantages of Power BI:
Advantages of Power BI
The following are the key benefits of Power BI:
1) Cost-effective: Power BI is more cost-efficient than Tableau, making it a great tool for MSME businesses.
2) Integration with Microsoft Products: Power BI can blend well with other Microsoft products, including Excel, Azure, and Office 365.
3) Ease-of-use: Its intuitive design is user-friendly for creating reports and dashboards, allowing even non-technical people to gain complete control over its design.
4) Strong Community Support: Power BI is available in many systems, requiring easier documentation. It is combined with forums for discussion and finding solutions to problems.
5) AI Capabilities: Through Power BI, you can easily integrate AI into the data analysis of the end product.
Master the latest Business Intelligence skills by registering for our Microsoft BI Training course – join now!
Disadvantages of Power BI
The following are the key limitations of Power BI:
a) Cost: The more advanced features of Power BI require a paid subscription, which can form a barrier for small businesses or individuals.
b) Data Complexity: Power BI is not suitable for complex data models, as it is difficult to manage and analyse.
c) Limited Customisability: Power BI has limited customisation options, which can be a drawback for some users.
d) Step Learning Curve: Although Power BI has a user-friendly interface, it is comparatively challenging to learn, especially for those with no technical background.
e) Performance Issues: Power BI can be tedious when dealing with large datasets or complex calculations, further impacting the user experience.
Unlock the power of business intelligence reporting with our expert-led Tableau Desktop Training course – join now!
What are the Advantages and Disadvantages of Tableau?
To identify the optimal choice between Power BI vs Tableau it is necessary to comprehend the advantages and disadvantages of both tools. The following are the advantages and disadvantages of Tableau:
Advantages of Tableau
The key advantages of Tableau are as follows:
1) Superior Visualisation: Tableau is renowned for its advanced and detailed visualisations.
2) High Performance: It can efficiently handle large datasets, making it suitable for big data projects.
3) Flexibility: Tableau is highly flexible in terms of data integration and blending.
4) Strong Analytical Capabilities: It offers powerful tools for deep data analysis.
5) User Community: Tableau has a wider, active, and supportive user community with plenty of online resources.
6) Innovative Features: It is continuously innovated with new features and updates.
Disadvantages of Tableau
The following are the key limitations of Tableau:
a) Costly Investment: Tableau is expensive, particularly for larger organisations that require multiple licenses or access to its more advanced features.
b) Steep Learning Curve: It can present a steeper learning curve compared to Power BI, especially for beginners or individuals who lack a technical background.
c) Performance Challenges With Extensive Data Sets: Tableau might encounter performance challenges when dealing with sizable data sets or intricate calculations, potentially leading to slower analytical processes.
d) Limited Real-Time Data Support: Tableau may need to be more proficient in handling real-time data or streaming data sources as specialised tools designed for real-time data processing.
Acquire lucrative skills in data visualisations using Tableau Desktop with our Tableau Interview Questions and Answers overview.
Power BI vs Tableau: Key Differences

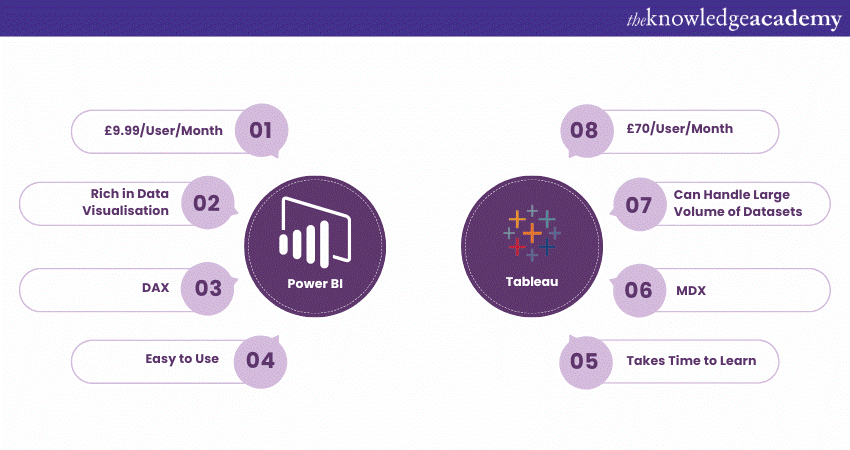
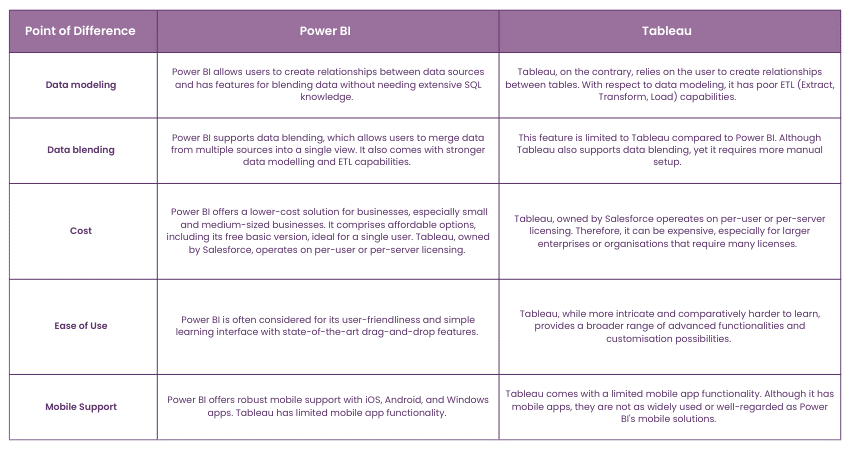
Power BI and Tableau are two of the most popular data visualisation tools used for creating interactive dashboards, reports, and charts. Both tools support various types of tables but differ significantly in their table format. The following are the differences between Power BI vs Tableau.
Which is Better- Power BI or Tableau?
Power BI and Tableau offer an intuitive and user-friendly platform for visualising data from a comprehensive dataset, ranging from businesses to massive industries. Choosing between them requires a detailed understanding of both, which we have described in the table below:

Power BI is often easier to learn for beginners, especially for those familiar with Microsoft products. Its intuitive interface and seamless integration with Excel and other Microsoft tools make it accessible. In contrast, despite being user-friendly, Tableau requires a steeper learning curve to master its advanced features and visualisations.
Conclusion
We hope you understand the Power BI vs Tableau topic and learn about the ideal tool for your needs and requirements. Power BI is comparatively cost-effective and integrates well with Microsoft products, making it ideal for small to medium-sized businesses. While Tableau suits well for advanced visualisations and handling large datasets, making it a preferred choice for data professionals and larger enterprises.
Create efficient and easily accessible reports and dashboards- Join Microsoft Power BI Training Now!
Frequently Asked Questions

Power BI is generally considered easier to learn for beginners on account of its user-friendly interface and seamless integration with Microsoft products. While Tableau has more advanced features, which may take more time to master, it offers greater flexibility in terms of visualisations.

Power BI is generally considered more popular than Tableau because it offers better pricing and integration with Microsoft products. Moreover, many users find it easier to use and access, which contributes to its growing popularity in businesses.

The Knowledge Academy takes global learning to new heights, offering over 30,000 online courses across 490+ locations in 220 countries. This expansive reach ensures accessibility and convenience for learners worldwide.
Alongside our diverse Online Course Catalogue, encompassing 17 major categories, we go the extra mile by providing a plethora of free educational Online Resources like News updates, Blogs, videos, webinars, and interview questions. Tailoring learning experiences further, professionals can maximise value with customisable Course Bundles of TKA.

The Knowledge Academy’s Knowledge Pass, a prepaid voucher, adds another layer of flexibility, allowing course bookings over a 12-month period. Join us on a journey where education knows no bounds.

The Knowledge Academy offers various Business Intelligence Reporting Courses, including Tableau Desktop Training, Microsoft Power BI Course and DAX Course. These courses cater to different skill levels, providing comprehensive insights into Data Visualisation with Tableau.
Our Office Applications Blogs cover a range of topics related to Business Intelligence Reporting offering valuable resources, best practices, and industry insights. Whether you are a beginner or looking to advance your knowledge on Business Intelligence Reporting, The Knowledge Academy's diverse courses and informative blogs have you covered.


 Top Rated Course


 If you wish to make any changes to your course, please


